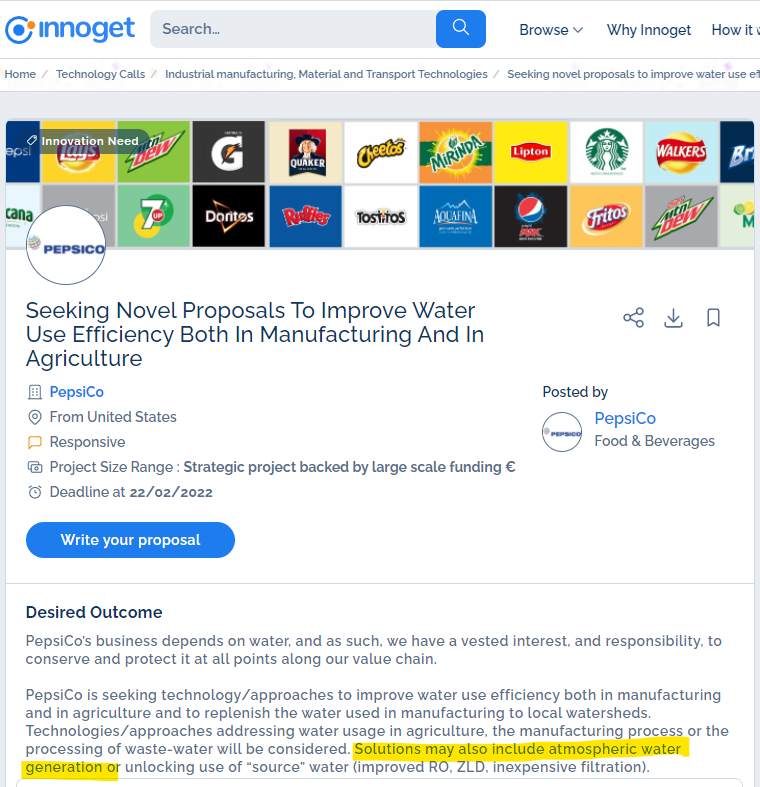
If you sell AWGs, I think the interactive map accompanying this Water Online article could serve as a useful guide for where to focus AWG marketing efforts in the USA.
 Go to article by clicking on image.
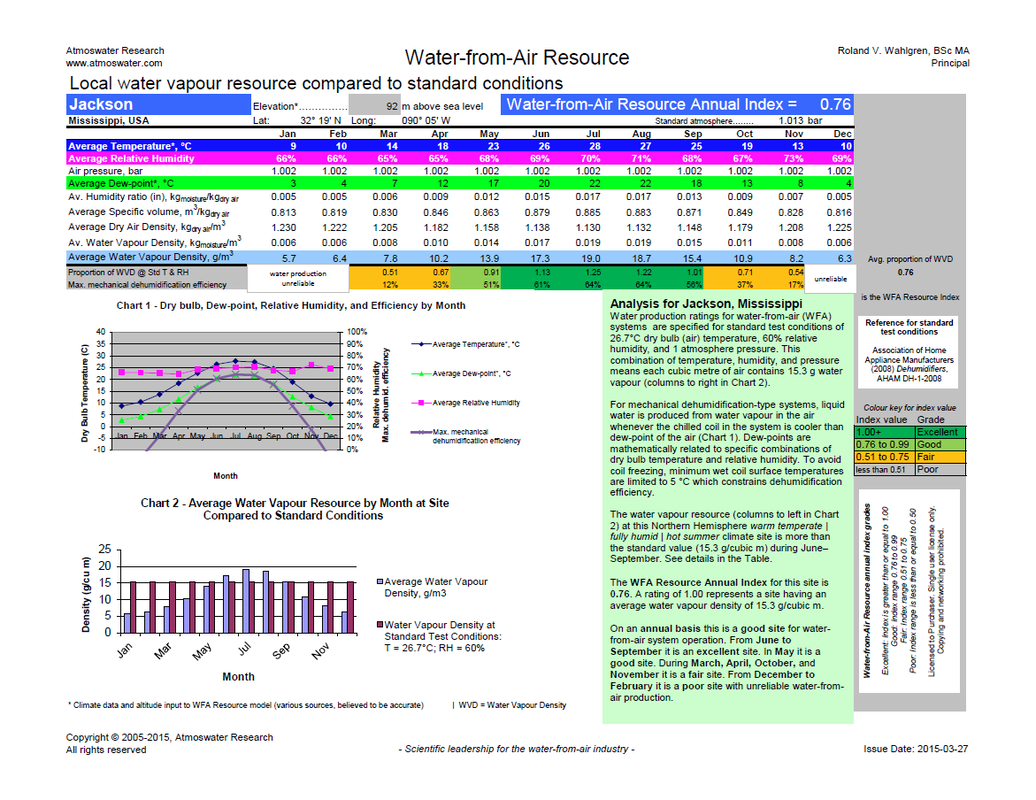
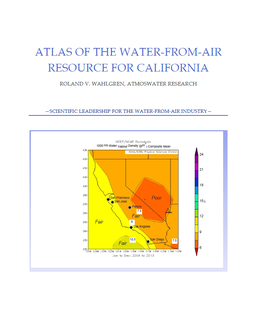
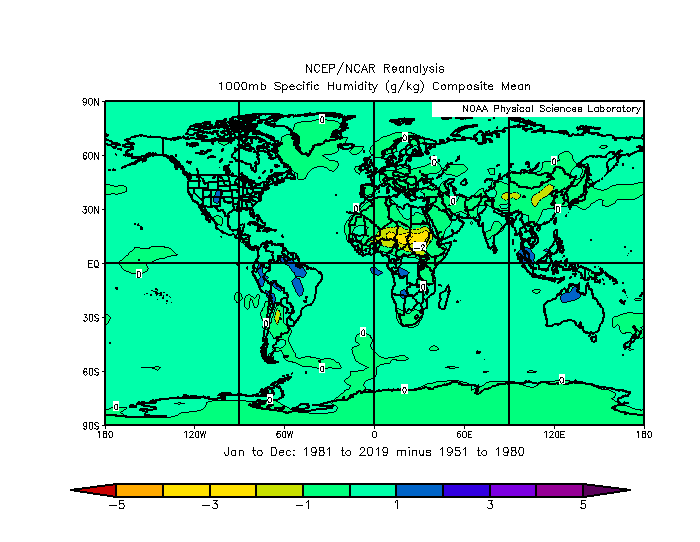
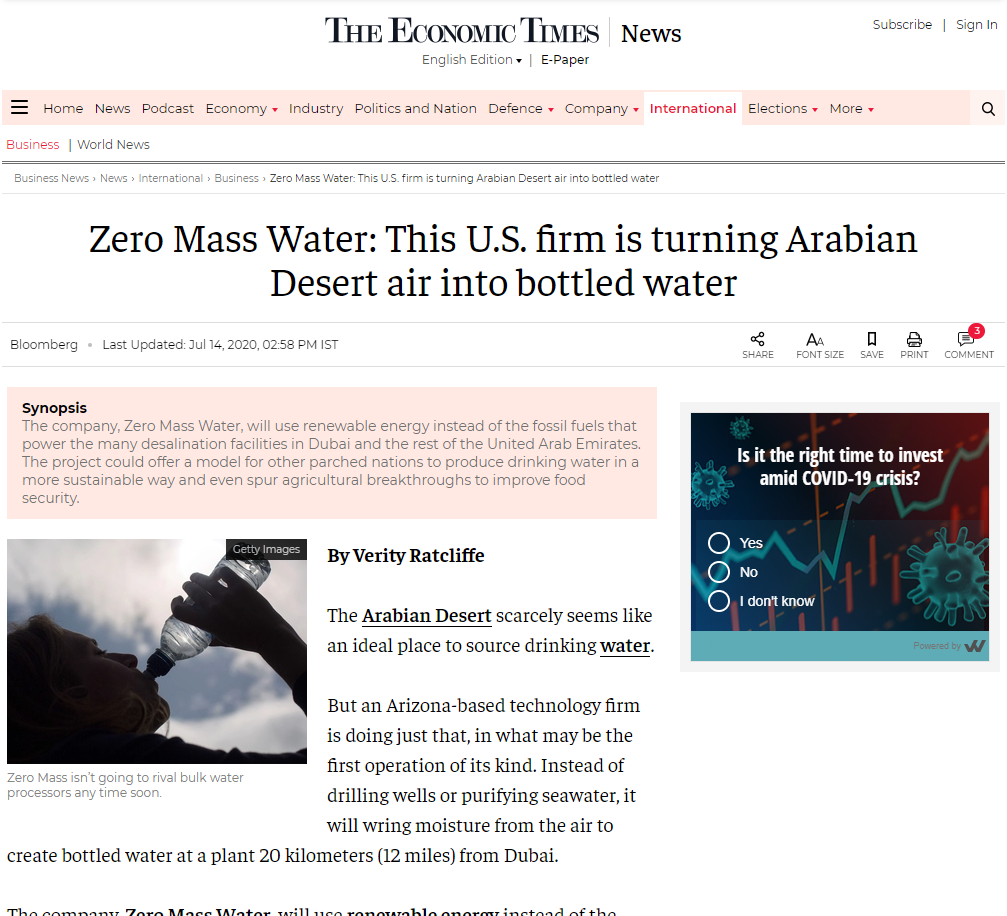
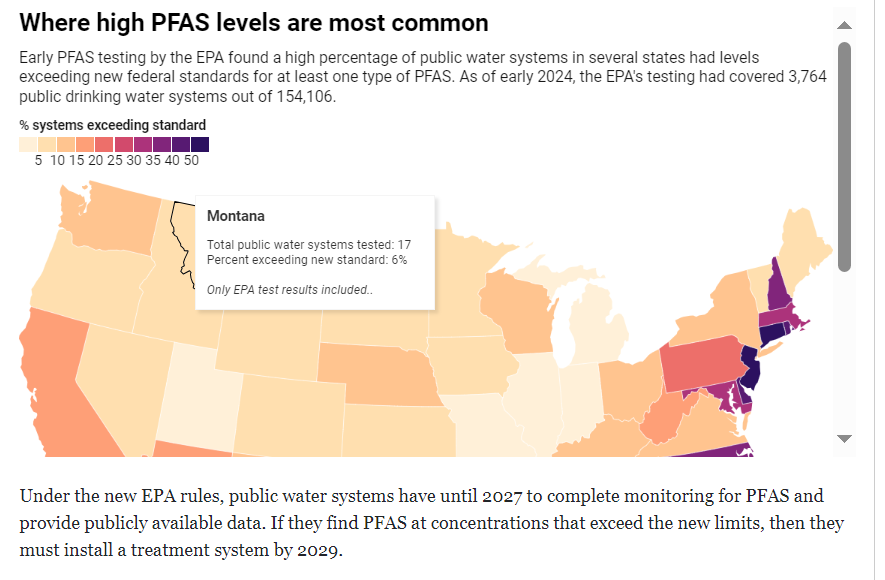
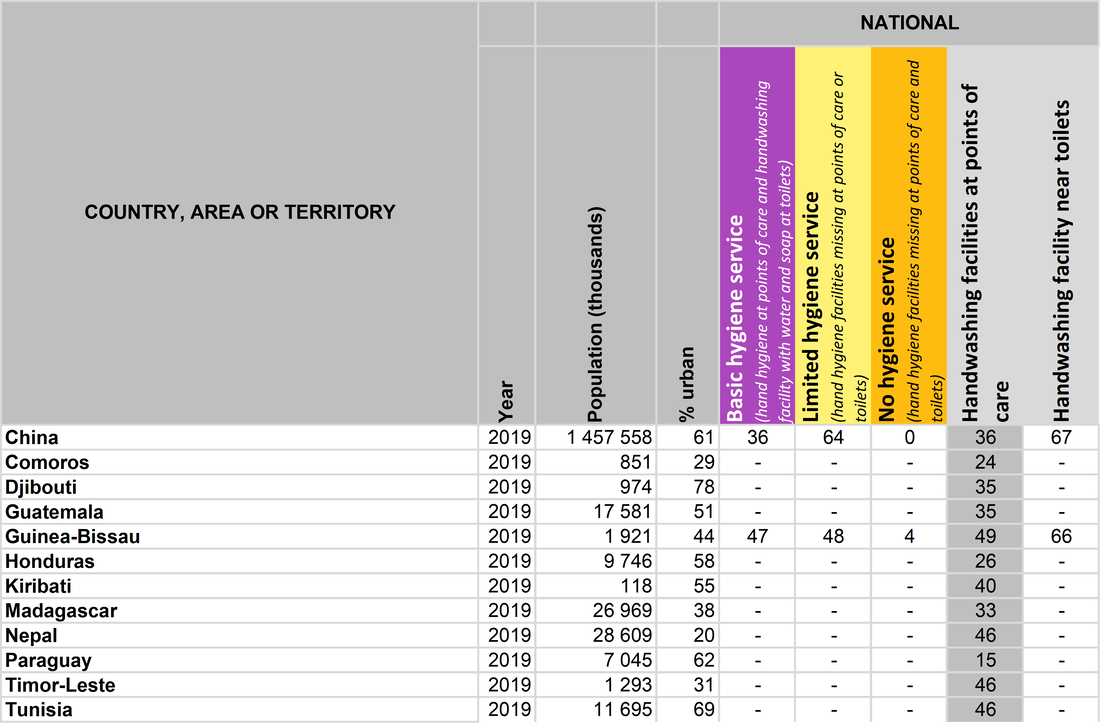
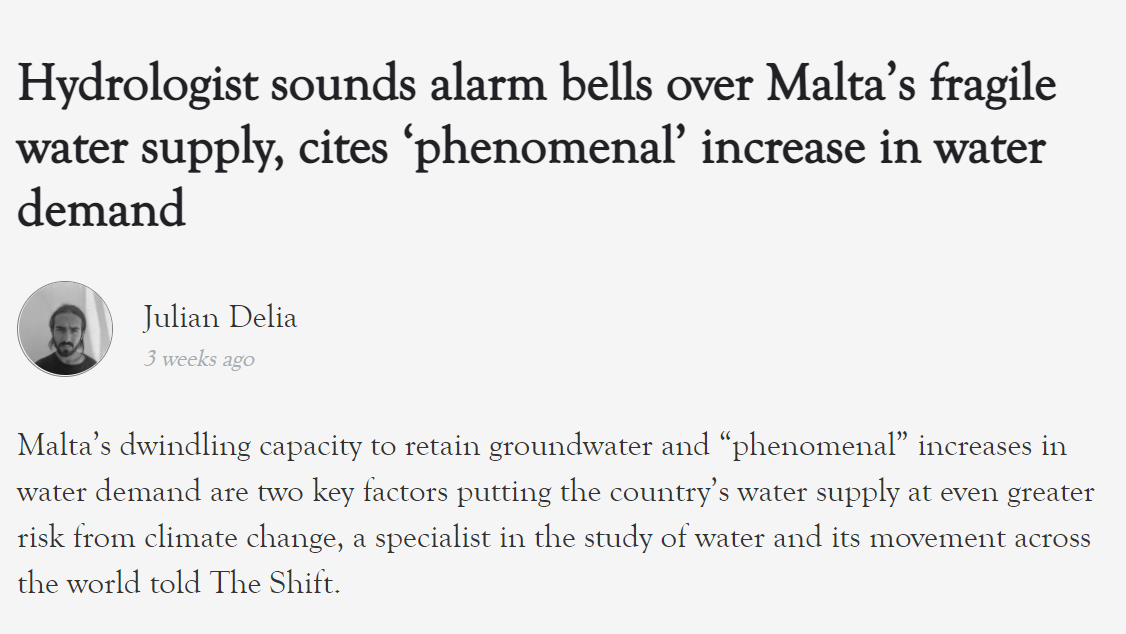
Go to article with its interactive map by clicking on the image