|
Registration is now open for the "Atmospheric Water, Part 3" Webinar on November 17. The registration page is at http://bit.ly/SGC-Nov17
0 Comments
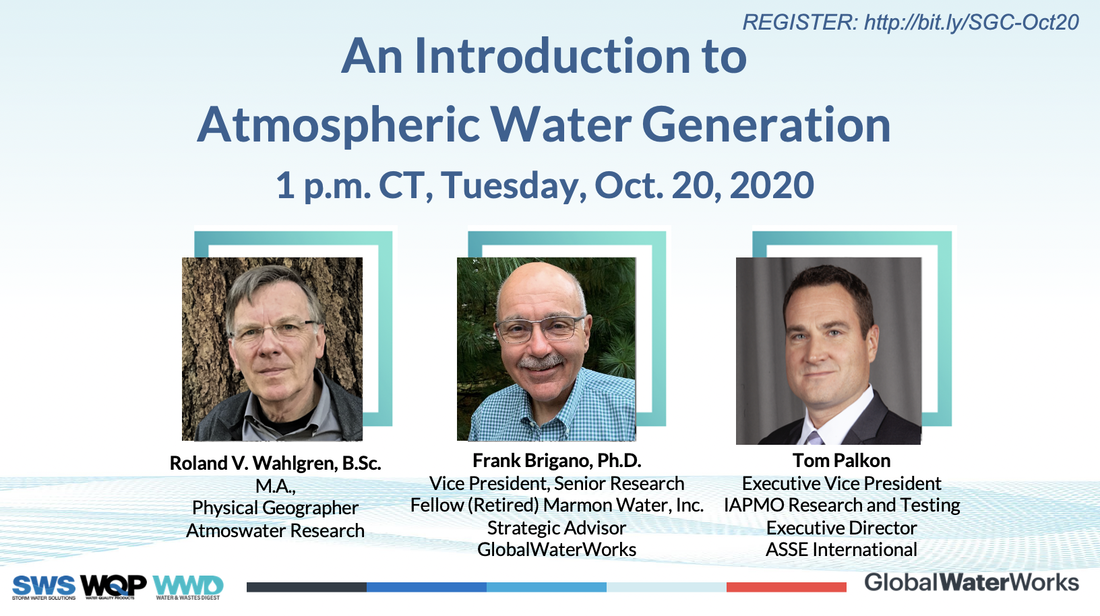
My answers to questions asked in Oct. 20, 2020 Webinar: Introduction to Atmospheric Water29/10/2020 Participants at this well-attended webinar had lots of questions---too numerous to answer during the Q & A period at the end of the webinar. So the three panelists were asked to reply to a set of questions---the answers were sent recently to the registered attendees. Here are my answers to the set of eight questions assigned to me. They cover a variety of topics. I hope you find the answers interesting and useful.
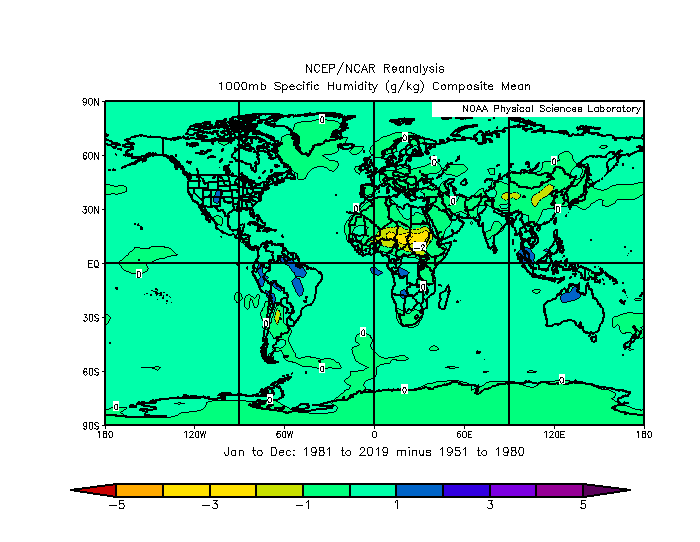
Impact on the atmospheric water reservoir from using water-from-air systems: an update (2021-09-27). [The big picture is the water cycle. Every moment, myriad processes, natural and human-caused, are evaporating and condensing huge amounts of water. Liquid water that humans consume for drinking is only temporarily with-held from the water cycle (hours or days). The atmosphere contains 15.5 million million cubic meters of water according to a 1995 report by the American Geophysical Union. Various natural processes already transport and distribute vast volumes of water vapor and liquid water across Earth. Even if every single human alive in 2050 (using the UN's 2007 projection for a population peak of 9,200 million people) used water from water-from-air machines at the rate of 50 L (0.050 cubic meters) per day, they would consume (temporarily) only 0.003% of the available atmospheric water. This scenario involving the entire human population is unlikely, so it is also unlikely that water-from-air technologies will cause a drier atmosphere in the context of the Earth’s water cycle and natural processes of water transport and distribution. Water vapor, the gas phase of water, diffuses along pressure gradients to zones of lower water vapor pressure. If a lot of water vapor was condensed into liquid water in a specific region such as a city, water vapor from outside the region would flow in immediately. No net loss of atmospheric water vapor density would be observed in the city. Water consumed for domestic water requirements does not exit from the water cycle. Within a day or so the liquid water that is used or temporarily with-held from the water cycle would be returned to the environment by evaporating into atmospheric water vapor. On a clearly bounded terrestrial surface such as a tropical island, atmospheric water vapor processing systems would increase slightly the annual precipitation. Let us say a large-scale AWG array is installed on an island such as Grand Turk (Turks & Caicos Islands). The island has a surface area of 18 square kilometers (1,800 ha). The AWG array produces water from the air at a rate of 75,335 cubic meters annually. This is equivalent to a rainfall of 7,533 mm over one hectare (10,000 square meters). The average annual precipitation of Grand Turk is 604 mm. This value would be enhanced by [7,533 mm/ha/1,800 ha] = 4 mm (or 0.7% annually, an amount less than the natural variability from year to year. The annual total precipitation in the year 2000, for example, was 704 mm. To reinforce the fact that long-term human direct impact on atmospheric water is negligible, note that dehumidifiers and air-conditioners dripping condensate have been increasingly used since the 1950s. I used NOAA global specific humidity data (measured in grams of water per kilogram of air) and subtracted the earlier 30-year 1951 to 1980 annual field from the more recent 39-year 1981 to 2019 field. The resulting map showed several pools of higher specific humidity (+2 g/kg). These are likely related to climate change. Drying of about -2 g/kg is noticeable over the Sahara and Gobi deserts---more likely to be related to climate change than use of HVAC equipment. Over most of Earth specific humidity has been remarkably stable (+/-1 g/kg) for the past seven decades. By the way, I posted the map in the Atmoswater Research blog. Indirect environmental impacts are more likely. These will be related to the materials used in manufacturing AWGs, product life cycle aspects, and so on. Also, AWGs will enable humans to expand their footprint which could increase population density in a region, lead to increased sewage and waste disposal challenges, and increase energy use. These analyses indicate widespread global atmospheric water use will not noticeably affect the world climate.]
More conventional sources of water have these electrical energy costs: - Surface water, public supply: 0.37 kWh/cubic meter (Young, 2014) - Groundwater, public supply: 0.48 kWh/cubic meter (Young, 2014) - Tap water, 0.46 kWh/cubic meter (Gleick & Cooley, 2009) - Municipal water (S California): 3 kWh/cubic meter (Gleick & Cooley, 2009) - Seawater Desalination (reverse osmosis): 2.5 to 7 kWh/cubic meter (Gleick & Cooley, 2009) - Seawater Desalination (reverse osmosis): 2 kWh/cubic meter (Elimelech & Phillip, 2011, p. S1) - Bottled Water: 519 to 945 kWh/cubic meter [Gleick & Cooley, 2009; thermal energy units were converted to electrical energy units (3:1) to derive these values] It was interesting to discover that AWGs used in tropical climates are competitive with bottled water. Keep in mind the apparently cheaper conventional sources may not even be available in some water scarce regions. The desalination costs do not include the apparently difficult to monetize costs of harming local ecosystems with brine disposal. References: Elimelch, M. & Phillip, W. A. (2011) Supporting Online Material for The Future of Seawater Desalination: Energy, Technology, and the Environment. Science 333, 712-717. Gleick, P. H. & Cooley, H. S. (2009). Energy implications of bottled water. Environ. Res. Lett. 4 (2009) 014009 (6pp). Young, R. (2014). Watts in a Drop of Water: Savings at the Water-Energy Nexus. An American Council for an Energy-Efficient Economy (ACEEE) White Paper. Retrieved from https://www.aceee.org/sites/default/files/watts-in-drops.pdf
- AWG rated for 5 gal/day: $300/gal (residential quality) - AWG rated for 10 gal/day: $420/gal (balance of list is commercial/industrial quality) - AWG rated for 40 gal/day: $178/gal - AWG rated for 140 gal/day: $121/gal - AWG rated for 800 gal/day: $98/gal - AWG rated for 1800 gal/day: $82/gal
The energy cost of water produced by a desiccant AWG was estimated two ways (note that kilowatt is a unit of power---the energy unit is kilowatt x hours, kWh, which is power acting over a period of time): a. Specifications for a line of industrial rotary desiccant dehumidifiers (using electrical energy) manufactured by Hangzhou Peritech Dehumidifying Equipment Co., Ltd. (http://www.desiccantwheeldehumidifier.com/sale-2082217-industrial-rotary-desiccant-dehumidifier-silica-gel-economical-dehumidifier.html). Their 14.4 L/day model produces water using 2.8 kWh/L (10.6 kWh/US gal or 10,600 kWh per 1000 US gal). Their 1,102 L/day model produces water using 1.3 kWh/L (4.9 kWh/US gal or 4,900 kWh per 1000 US gal). b. Using information in the SOURCE Global (formerly Zero Mass Water) Patent Application US 2018/0043295 A1. The document includes an example of operation in Amman, Jordan at 14:00 on a July day. Airflow is 90 cfm. Relative humidity is 30%. A solar thermal panel with surface area 1.5 square meters provides 700 W (at 50% efficiency) to heat the desiccant to release captured water at the rate of 0.3 L/h. This information can be interpreted three different ways because international consensus is lacking on comparing different energy sources (e.g., solar thermal versus electricity; read more at the American Physical Society Site https://www.aps.org/policy/reports/popa-reports/energy/units.cfm). We need to make this comparison because the Peritech dehumidifiers and all chilled-coil AWGs are energized by electricity. i. Thermal energy = electrical energy cost of water = (700 W x 1 h)/0.3 L = 2.33 kWh/L; efficiency of solar thermal assumed to be 100% as per OECD/IEA publication guidelines ii. Equivalent electrical energy cost = 0.76 kWh/L; efficiency of solar thermal assumed to be 33% as per DOE/EIA (USA) publication guidelines iii. Equivalent electrical energy cost = 1.17 kWh/L; efficiency of solar thermal assumed to be 50% as stated in the patent application The range of energy costs for the SOURCE Global patent application example is 2.8 kWh/US gal (2,800 kWh per 1000 US gal) to 8.7 kWh/US gal (8,700 kWh per 1000 US gal). Has widespread use of dehumidifiers and air-conditioners dripping condensate affected in the long-term the amount and geographical distribution of water vapour in the atmosphere? An analysis using data available from NOAA suggests not. The figure above shows the difference field of specific humidity resulting from subtracting the composite means (Jan to Dec) for the 30 year period 1951 to 1980 from the 39 year period 1981 to 2019, Several pools of higher specific humidity +2 g/kg are noticeable. These are likely related to climate change. Drying of about -2 g/kg is noticeable over the Sahara and Gobi deserts---more likely to be related to climate change than use of HVAC equipment. Overall, specific humidity has been remarkably stable (+/-1 g/kg) over the past seven decades.
Reference: NCEP Reanalysis Derived data provided by the NOAA/OAR/ESRL PSL, Boulder, Colorado, USA, from their Web site at https://psl.noaa.gov/ Please join us for this webinar by registering at http://bit.ly/SGC-Oct20 where you will find additional information.
|
Roland Wahlgren
I have been researching and developing drinking-water-from-air technologies since 1984. As a physical geographer, I strive to contribute an accurate, scientific point-of-view to the field. Archives
May 2024
Categories
All
|


