- Materials science is fostering advances;
- Globally, there are relatively few commercial installations;
- The energy cost of water-from-air remains an obstacle;
- Desiccant technologies coupled with renewable energy sources are likely to be a versatile path forward;
- Relevant markets are remote arid regions with little or no conventional water supplies;
- Energy efficiency depends on a deep understanding of water properties; and
- Although water-from-air has "unique advantages" being "accessible anywhere" and readily used with renewable energy its "role in providing freshwater is still open for discussion".
|
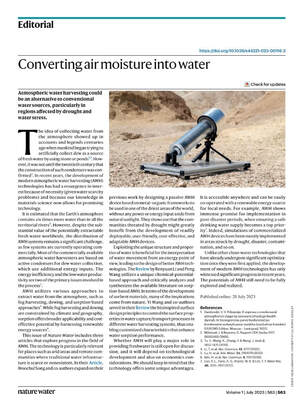
Water-from-air technologies are attracting serious attention as shown by a recent editorial in the journal Nature Water. Highlights from the editorial include:
0 Comments
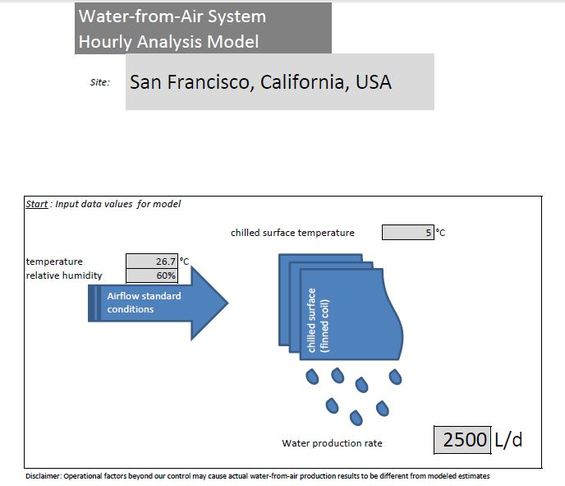
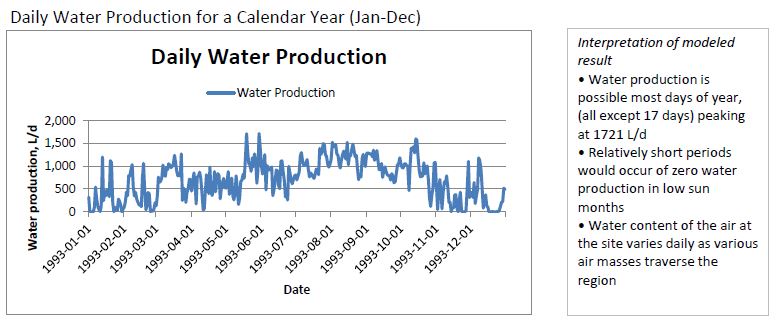
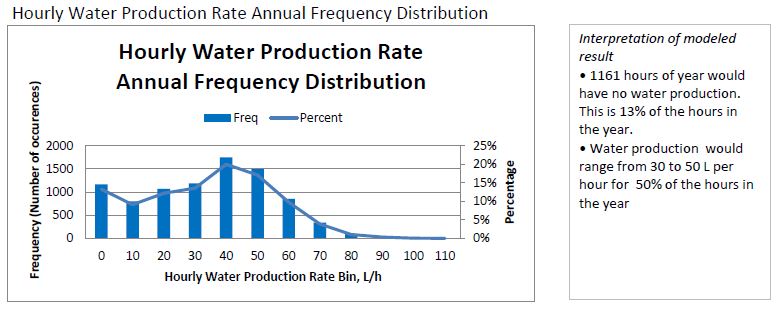
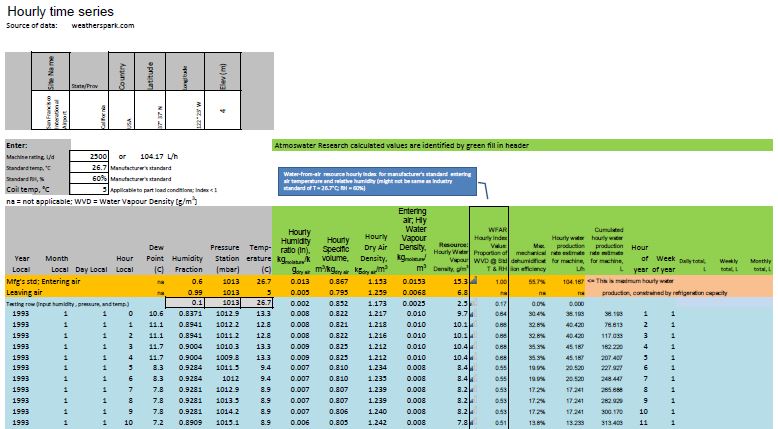
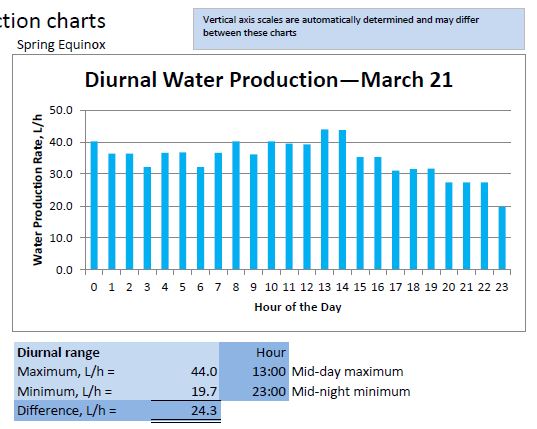
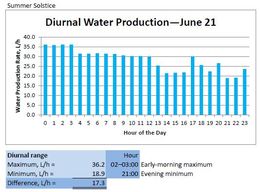
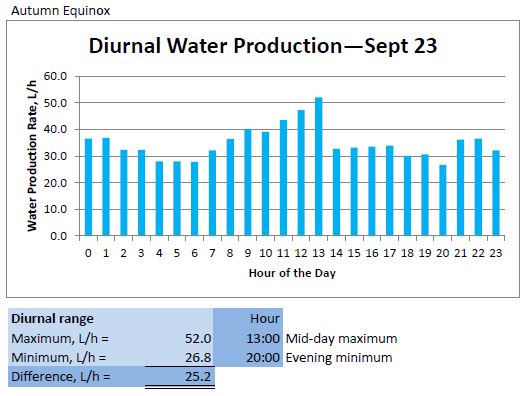
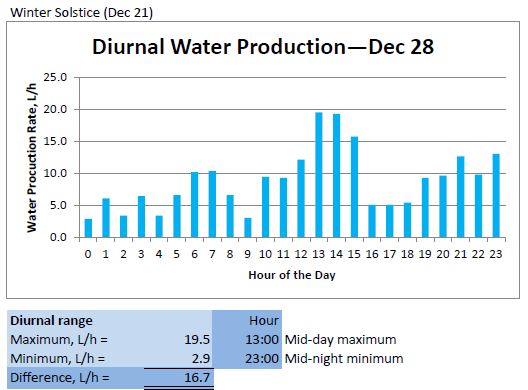
A Water-from-Air System Hourly Analysis Model for San Francisco, California is available as a free download on the Atmoswater Research website. During the prevailing California Drought, seventeen rural communities were identified by the California Department of Public Health as having "drinking water systems at greatest risk". Two of the affected counties, Sonoma and Santa Cruz are adjacent north and south respectively to San Francisco. Therefore, it is interesting to take a tour through the San Francisco hourly analysis model to see what it can tell us about the feasibility of using water-from-air machines (atmospheric water generators) as alternative or additional water resources in drought affected communities in Sonoma and Santa Cruz. Tour Stop 1 Tour Stop 2 Tour Stop 3 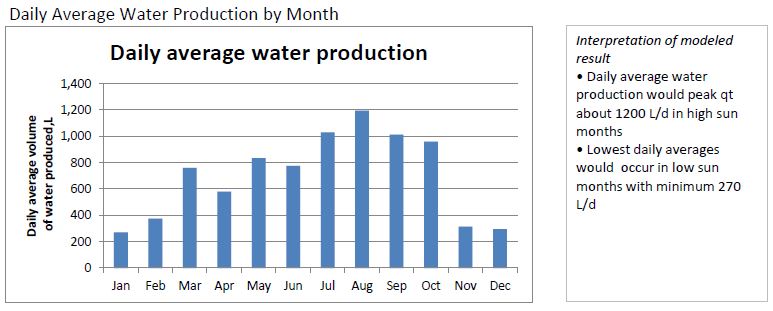 Tour Stop 3: Daily Average Water Production by Month with an interpretation of the modeled result. In a water crisis situation, each person needs 5 L/day of drinking water. Total daily water demand per person to take care of their drinking, cooking, sanitation, and bathing needs is typically 50 L/day. (Click to enlarge) Tour Stop 4 Tour Stop 5 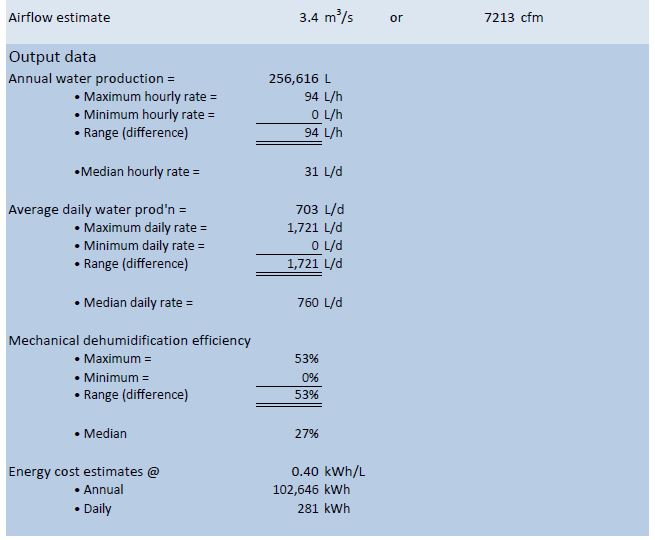 Tour Stop 5: With an average daily water production of 703 L/d, one machine could serve 14 people at the 50 L/d level or 140 people at the minimal 5 L/d level of drinking water consumption. Water storage is needed to distribute the annual water production evenly over the year. Several machines can be distributed throughout a region to serve larger populations. Water-from-air is a unique decentralized way of obtaining water. It is not absolutely necessary to think of a central water production hub. The machines can be placed where they are needed. Tour Stop 6 Tour Stop 7 Tour Stop 8 Tour Stop 8: In San Francisco, the diurnal regime of the water-from-air resource is somewhat variable with the seasons. (Click on images to enlarge them) I hope you found this tour interesting! The entire model output consists of 120 pages. Becoming familiar with how a water-from-air machine responds with its freshwater production to the hourly weather at a site is a unique experience that really helps make sound decisions about whether or not to use these machines in various drought situations.
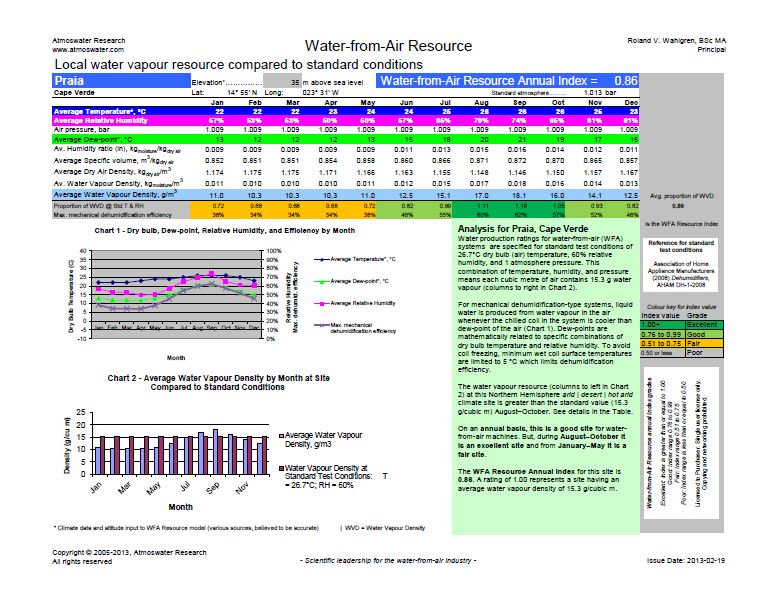
The San Francisco model shown here used weather data from 1993 because that was available as a free sample from a weather data vendor. Given the realities of climate change it would be interesting to run the model with 2013 data. I can run models for key drought locations in California. The price per model run report is [ask for quote] (USD). Please allow up to five business days for delivery as a PDF download. Why use a Water-from-Air Resource Chart? Well, this colourful output from a computer model is a marvelous tool for understanding how well water-from-air machines (atmospheric water generators; AWGs) would perform at your location. "Knowledge is power"--there is value to being well-prepared before talking to equipment suppliers, consultants, or project colleagues.
Let me guide you through this information-packed chart.
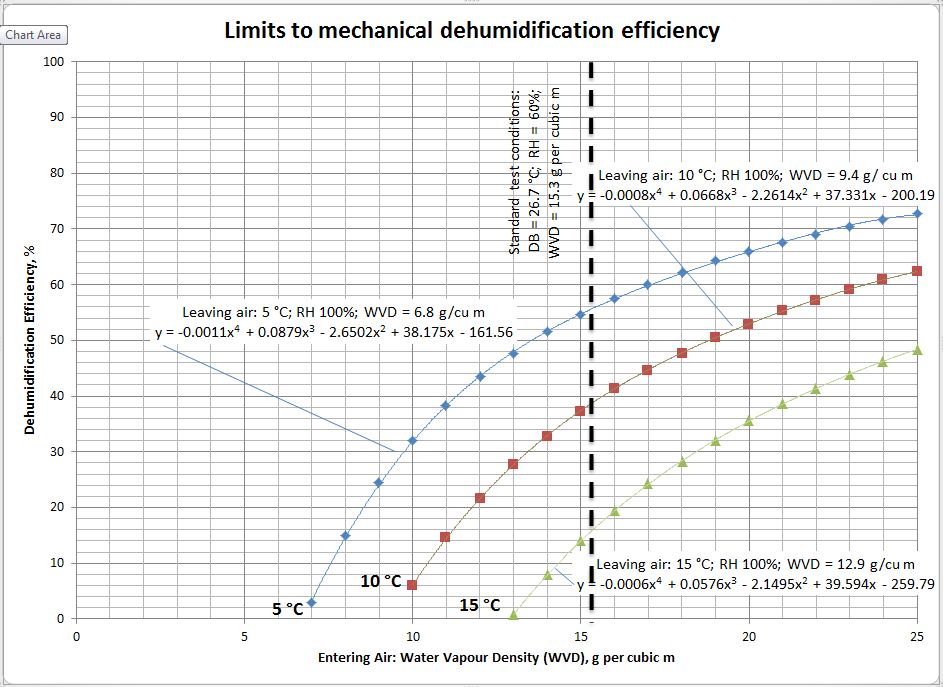
Charts for many different locations are available from Atmoswater Research. You are welcome to ask me to produce charts for places of interest that are not listed yet. When designing drinking-water-from-air systems it is useful to know the limits to mechanical dehumidification efficiency. Mechanical dehumidifiers use chilled water coils, direct-expansion refrigerant coils or thermoelectric devices to provide a cooled surface over which flows the air to be dehumidified. Systems are designed usually with defrost controls to avoid frosting of the coil surface. Practically, the minimum temperature for coil operation is about 5 °C. The air leaving a wet coil is saturated so the state of leaving air may be, for example, dry bulb = 5 °C with 100% relative humidity. This combination of temperature and humidity is associated with air having a water vapour density (WVD) of 6.8 grams of water per cubic metre of moist air. The blue curve in the chart below shows how efficiency of water collection varies depending on the water vapour density of the ambient (entering) air.
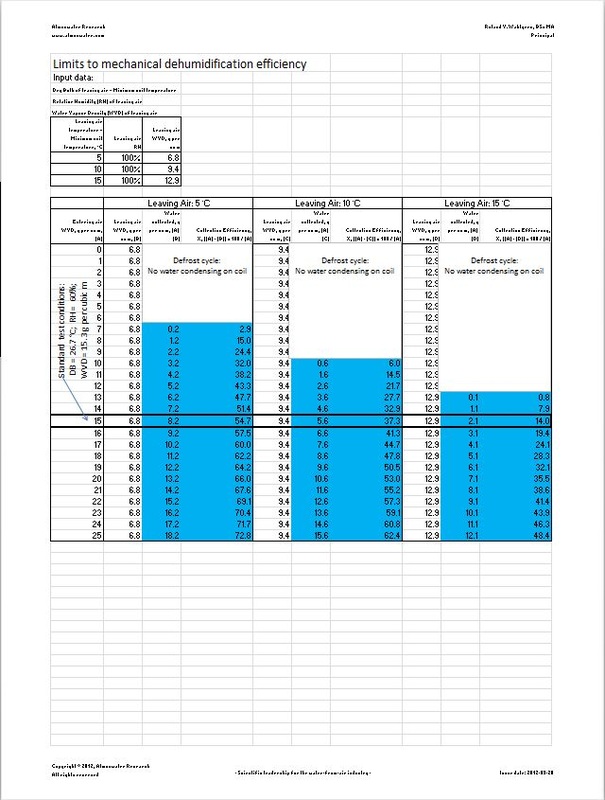
Let's use an example to explain how the curve was constructed. Ambient air at standard testing conditions of 26.7 °C, 60% relative humidity enters the dehumidifier (atmospheric water generator). At standard atmospheric pressure of one atmosphere (1.013 bar), psychrometric calculations show the ambient air is capable of holding 15.3 grams of water vapour in a moist air volume of one cubic metre. As this unit volume of air flows across the 5 °C chilled surfaces of the coils the mass of condensate collected = (15.3 g per cubic metre - 6.8 g per cubic metre) x 1 cubic metre = 8.5 g. The table below shows a series of similar calculations encompassing the natural range of water vapour densities in the atmosphere at the Earth's surface (about 4 to 22 g per cubic metre). Ambient temperature together with the refrigeration capacity of the dehumidifier will determine whether or not a chilled surface temperature of 5 °C can be achieved. Therefore, the chart also has efficiency curves for leaving air at 10 °C and 15 °C. In Belize City air temperature was about 32 °C and the 40 Ton refrigerant capacity machine I was testing for my client had a leaving air temperature (similar to coil temperature) of 16 °C. Efficiency of water production was about 45%, near the limit of what could be expected given the weather conditions and equipment capacity. The atmospheric water generator (about the size of a 20-foot shipping container) was producing drinking water at the rate of about 2500 L/day—its designed capacity. Note: You may click on the chart and table to enlarge them. |
Roland Wahlgren
I have been researching and developing drinking-water-from-air technologies since 1984. As a physical geographer, I strive to contribute an accurate, scientific point-of-view to the field. Archives
May 2024
Categories
All
|
