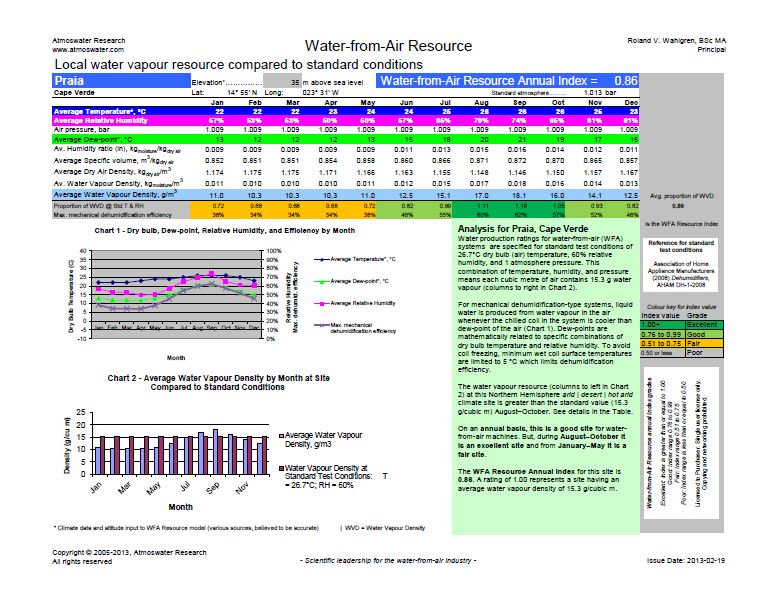
Let me guide you through this information-packed chart.
- Local water vapour resource compared to standard conditions: At standard conditions of 26.7° C dry bulb temperature and 60% relative humidity and 1 atmosphere air pressure (sea level) there is 15.3 grams of water vapour in every cubic metre of moist air. The local water vapour density (the resource) may be less, equal, or greater. By using a standard it is possible to compare one location to another, compare one month to another, compare one hour to another, and so on.
- Elevation is an important input to the model because water vapour density normally decreases with altitude.
- Latitude and longitude are for reference—usually water vapour density decreases with increasing latitude north or south (moving from the equator to the poles).
- Monthly average temperatures for the location are obtained from various reliable sources.
- Monthly average relative humidity values for the location are calculated by the model once it knows the monthly average dew-points.
- Monthly average air pressures are calculated from the elevation information relative to the standard atmosphere at sea level which is 1.013 bar.
- Humidity ratio, specific volume, and dry air density are intermediate values the model needs to calculate the average water vapour density in kilograms of moisture per cubic metre of air.
- The highlighted-in-blue values of water vapour density have the units [g/cubic metre] to make the values easier to read and comprehend. A gram of water is represented by the 1 mL division on graduated cylinder laboratory glassware.
- Proportion of water vapour density (WVD) at standard temperature (T) and relative humidity (RH) = (monthly average water vapour density) / (15.3 g/cubic m); This proportion is also called the index value.
- Maximum mechanical dehumidification efficiency = [(average water vapour density - 6.8 g/cubic m)/(average water vapour density)] × 100%; Where 6.8 g/cubic m is the water vapour density of air at 5°C and 100% relative humidity at 1 atmosphere pressure—this models air leaving a wetted, unfrozen dehumidifier coil as being warmer than the freezing point of water and containing all the water vapour it can hold at the leaving temperature; The efficiency value is constrained to be less than 100% because in practice the coil temperature is regulated to 5°C or above to prevent freezing of water onto the coil which causes overload and damage to the machine's compressor(s). An exploration of maximum efficiency for mechanical dehumidifiers is found in an earlier blog post.
- Index value colours are applied to the index and efficiency values so the chart user can grasp at a glance the seasonal pattern of the water-from-air resource. The colour key and grade wording (excellent, good, fair, poor) for the index values is shown at the right-hand side of the page.
- The annual index value is the average of the monthly index values.
- Chart 1 is a month-by-month graphical display of average values of temperature (dry bulb), dew-point, relative humidity, and efficiency.
- Chart 2 is a month-by-month graphical display of average values of water vapour density (WVD; left blue columns) relative to the constant (right pink/red columns) standard condition WVD = 15.3 g/cubic metre.
- An analysis section for the location enables each chart to be a stand-alone document with a concise explanations about standard conditions, the dehumidification process, and efficiency. This section also identifies the location's climate zone and expresses in words how effective a water-from-air machine would be at the site throughout the year.
Charts for many different locations are available from Atmoswater Research. You are welcome to ask me to produce charts for places of interest that are not listed yet.


