[Text excerpted and adapted from Technical Bulletin No. 5 (revised 2023)—Environmental impact of widespread use of drinking-water-from-air systems issued by Canadian Dew Technologies Inc.
This blog post supersedes two earlier blog posts on the same topic (My answers to questions asked in Oct. 20, 2020 Webinar: Introduction to Atmospheric Water and Impact on the atmospheric water reservoir from using water-from-air systems: an update) The human population keeps increasing and estimates have been refined of the atmospheric water reservoir volume.
Concern has been expressed by some potential users of WFA systems that widespread use in a region could decrease the water vapour content of the atmosphere. If this was the case, would regional weather and climate be affected?
Assessing Environmental Impact on the Atmospheric Water Reservoir
Earth’s estimated human population is now 8 billion, projected to increase to 10.4 billion in 2100 (https://population.un.org/dataportal/home) so the 1993 worst-case impact estimate was updated as follows in the next paragraph, incorporating a revised per capita water consumption value of 50 L/day as suggested by Gleick (1998) for domestic water requirements (drinking, kitchen, laundry, and bath). Revised water cycle information was from Abbott et al. (2019).
The atmosphere contains 12.9 × 10^12 m^3 of water or 0.001% of the Earth’s total water reservoir volume of 1.38 × 10^18 m^3. Water reservoirs include the atmosphere, ice and snow, biomass, surface water, underground water, and the oceans. Even if all 8 × 10^9 people on Earth used water from water vapour processors at the rate of 50 litres per day, they would consume only 0.003% of the available atmospheric water. In 2100, when population is expected to rise to 10.4 × 10^9, this worst-case impact would rise slightly to 0.004%.
Water vapour, the gas phase of water, diffuses along pressure gradients to zones of lower water vapour pressure. If a lot of water vapour was condensed into liquid water in a specific region such as a city, water vapour from outside the region would flow into the region. No net loss of atmospheric water vapour would be observed in the city.
Water consumed for domestic water requirements does not exit from the water cycle. Within a day the water that is used or temporarily withheld from the water cycle would be returned to the environment to evaporate into atmospheric water vapour.
Quantifying the Direct Environmental Impact of Dehumidifiers and Air-Conditioners on the Atmospheric Water Reservoir
An unintentional experiment has in fact already been running for the past 70 years. This experiment allows us to quantify the environmental impact to date of the human population processing atmospheric water vapour on a grand scale.
Since about 1950 the widespread use of dehumidifiers and air-conditioners across the globe has resulted already in vast volumes of condensate dripping from millions of machines. In fact, Wikipedia: Air Conditioning (https://en.wikipedia.org/wiki/Air_conditioning) stated, "According to the IEA [International Energy Agency], as of 2018, 1.6 billion air conditioning units were installed...." The same Wikipedia article said, "Innovations in the latter half of the 20th century allowed for much more ubiquitous air conditioner use. In 1945, Robert Sherman of Lynn, Massachusetts invented a portable, in-window air conditioner that cooled, heated, humidified, dehumidified, and filtered the air."
Has this experiment affected, in the long-term, the amount and geographical distribution of water vapour in the atmosphere? An analysis using data available from NOAA suggests not. Figure 1 shows the difference field of specific humidity resulting from subtracting the composite means (Jan to Dec) for the 10-year period 1948 to 1957 from the 20-year period 2013 to 2022. Surprisingly, several regions of increased specific humidity +1 to +2 g/kg are noticeable along Earth’s Tropical Belt. The increased water vapour content of the atmosphere is likely linked to global warming causing increased evaporation. Drying of about -2 to -3 g/kg is associated with the eastern Sahara and the Gobi deserts—more likely to be related to climate change than use of air-conditioning equipment in these sparsely populated areas. For most of Earth’s surface, specific humidity has been remarkably stable (+/-1 g/kg) over the past seven decades.
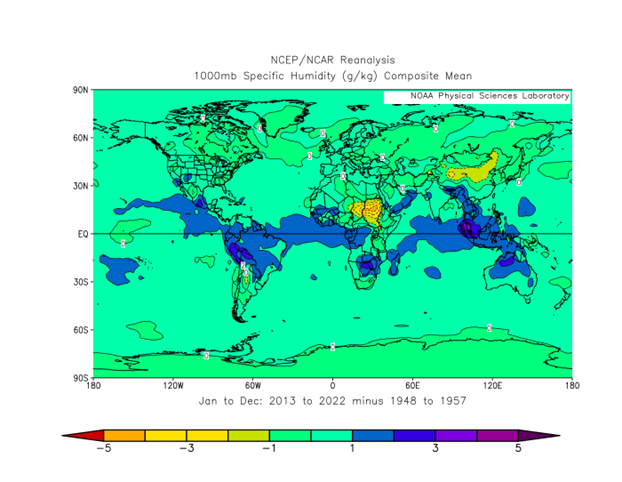
Figure 1. The difference field of specific humidity resulting from subtracting the composite means (Jan to Dec) for the 10-year period 1948 to 1957 from the 10-year period 2013 to 2022. Reference: NCEP Reanalysis Derived data provided by the NOAA/OAR/ESRL PSL, Boulder, Colorado, USA, from their website at https://psl.noaa.gov/
Precipitation Enhancement
On a well-defined land surface such as a tropical island, atmospheric water vapour processing systems would effectively increase annual precipitation. A viability study for a WaterProducer-Greenhouse™ (WPG) system on the tropical North Atlantic island of Grand Turk (with surface area 18 km^2 = 1800 ha = 18,000,000 m^2) illustrated this effect (Wahlgren, 2002). The proposed WPG system would produce water at a rate of 75,335 m^3 per year. This is equivalent to a rainfall depth of 75,335 m^3 / 18,000,000 m^2 = 0.00418 m = 4.18 mm. The average annual precipitation of Grand Turk is 604 mm. The WPG operation would augment this value by 4 mm (0.7% annually), an amount less than observed natural variability from year to year. The annual total precipitation in 2000, for example, was 704 mm (Wahlgren, 2002, 30).
Indirect Environmental Impacts
Using new technology such as atmospheric water vapour processing in drinking-water-from-air machines may have other impacts on Nature. These include:
• Possibility for more people to live in a region, thereby increasing the population density;
• Increased sewage and other waste (including material waste from machines which have reached the end of their operational life and are scrapped);
• Increased energy use (to operate the machines); and
• Increased material use (to build the machines).
Conclusion
The quantitative analyses outlined in this bulletin demonstrate that the direct environmental impact of widespread use of atmospheric water vapour processing technology can be considered negligible. In summary, scenarios involving the entire human population using processors of atmospheric water vapour are unlikely, so it is also unlikely that water-from-air technologies will cause a drier atmosphere in the context of the Earth’s water cycle and natural processes of water transport and distribution.
References
Abbott et al. (2019). Human domination of the global water cycle absent from depictions and perceptions. Nature Geoscience 12, 533–540, 10 June 2019.
Gleick, P. H. (1998) The World’s Water 1998–1999: The Biennial Report on Freshwater Resources. Island Press, Washington, DC.
van der Leeden, F., Troise, F. L., and Todd, D. K. (1990) The Water Encyclopedia, 2nd ed. Lewis Publishers Inc., Chelsea, Michigan.
Wahlgren R. V. 2002. Technical Feasibility Study—Grand Turk Solar Desalination Greenhouse for Water + Food™, 2nd ed. (revised September 2002). Report delivered to Batavia Greenhouse Builders Ltd. by Atmoswater Research, North Vancouver, BC, Canada.