 Measuring water production from an AWG in Belize
 While helping a client commercialize water-from-air systems, I got frequent questions about how well atmospheric water generators would perform at various locations around the world. A common misconception was that relative humidity values told the whole story. Higher humidity means more water in the air and better water production. Right? Not really!
The water vapour content of the air, sometimes referred to as "absolute humidity", has the proper scientific name "water vapour density" with units of [grams of water vapour per cubic metre of air]. The water vapour density depends on three measures all at the same time: the air's dry bulb temperature, relative humidity, and atmospheric pressure.
Monthly average climate data for air temperature (dry bulb) and relative humidity is fairly easy to obtain for many places. Average air pressure at a location can be estimated knowing the site's altitude above sea level. Using well-known formulas used in the heating, ventilation, air-conditioning field (HVAC) the average monthly water vapour density can be calculated.
Once water vapour density was known, I could use information about the airflow (in units of cfm or cubic feet per minute) through my client's machines to estimate water production of various designs. The focus on water production was fine for a manufacturer and its customers.
Later, as an independent consultant, potentially dealing with end-users of atmospheric water generators having all sorts of different specifications for airflow I decided it was better to focus on the actual water vapour resource to make charts of wider usefulness.To make it easier to compare how good a site is for atmospheric water generators I had the idea of indexing the water vapour density by dividing the density values by the water vapour density 15.3 g/cubic metre which is the density at the standard measurement conditions of 26.7°C air temperature; 60 % relative humidity. When the water-from-air resource monthly index = 1.00, the expected drinking water production rate from an atmospheric water generator (AWG) at the site should be the same as the machine's specified water-from-air production rate. I gave the Water-from-Air Resource (WFAR) annual index grades (Excellent: Index is greater than or equal to 1.00; Good: Index range 0.76 to 0.99; Fair: Index range 0.51 to 0.75; and Poor: Index range is less than or equal to 0.5) and assigned colours to make it easier to interpret the charts.
A lot of information about a site, all relevant to using water-from-air systems is packaged onto the 8.5 inch x 11 inch landscape format of the charts!
- Geographic coordinates and elevation;
- Monthly average temperature, humidity, pressure, and dew-point;
- Monthly average water vapour density;
- Monthly average maximum mechanical dehumidification efficiency;
- Graph to visualize how temperature, humidity, dew-point, and efficiency vary together by month;
- Graph to visualize and compare monthly average water vapour density with water vapour density at standard conditions;
- Summary of the analysis, identifying the climate zone and expected atmospheric water generator performance for various periods during a year; and
- Annual index to compare the water-from-air resource between locations
- They don't have to spend their own time and resources responding to ongoing questions about how good or bad a place is for operating water-from-air systems. This gives just a bit extra time for concentrating on growing their business and profits;
- Risk reduction by understanding the characteristics of the water-from-air resource at a site. Why alienate their customer by selling them a machine that might only work properly a couple of months of the year at a site? Better to forgo that sale and focus on sites where the machine return on investment is more favourable;
- The charts make their business more valuable—they become more of an expert at what they do;
- They find it easier to achieve sales targets because quantitative information, rather than a guesstimate is available; and
- Surprises are removed with having solid quantitative knowledge about the water-from-air resource at sites.
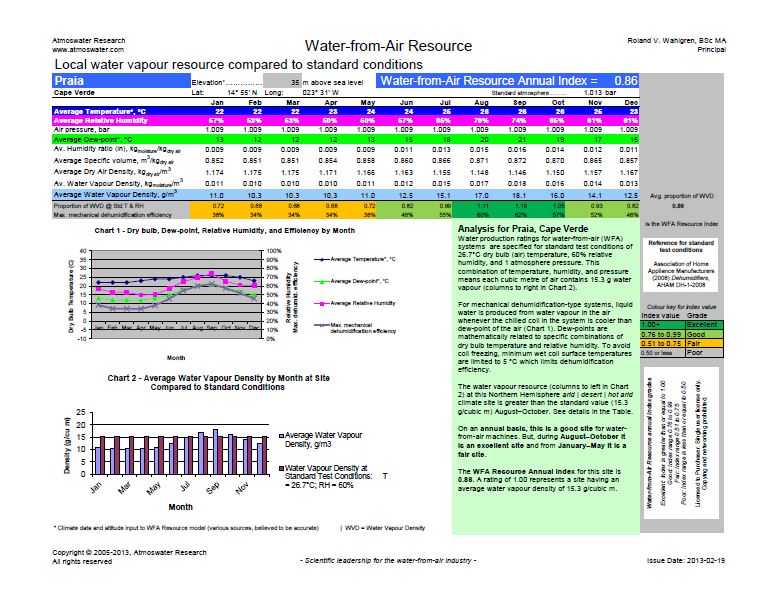
Water-from-Air Resource Chart for Praia, Cape Verde (click to enlarge).

