Atmoswater Research
+1 604-985-3720
  • Home
  • Atmoswater Blog
  • About
  • Contact
  • Books (HVAC&R)
    • Water-from-Air Book
  • Useful Lists
    • Manufacturers and Suppliers of Atmospheric Water Generators & Water-from-Air Machines
    • Case Studies About Water-from-Air
    • Atmospheric Water Generator or Water-from-Air Machine Market Research Links
    • Projects about Water-from-Air
    • Articles about Water-from-Air >
      • ScienceDaily Article Links
    • Patents about Water-from-Air and Atmospheric Water Generators
    • Water Lexicon
  • Links, FAQ, & Video
    • Drinking-water Industry Organizations Links
    • Map of the Water-from-Air Resource
    • Topic Links for Water-from-Air
    • Trends for Water-from-Air
    • Water Industry News Links
    • Water Organizations Links
    • Water-from-Air FAQ
    • Video about Water-from-Air
  • Scientific & Technical Consulting
    • Consulting Physical Geographer
    • Research Services in Climatology, Geomorphology, Hydrology, and Oceanography
    • Translations of Scientific and Technical Documents (Swedish, French)
    • Projects >
      • Our Projects
      • Atmospheric Water Vapour Processing (AWVP)
    • Publications by Roland Wahlgren >
      • Publications List for Roland Wahlgren
      • GSC 77-1A (Beaufort Sea Sediment Cores)
      • M.A. Thesis (Beaufort Sea Ice-scour Tracks)
      • GSC 79-1B (Beaufort Sea Ice-scour Tracks)
      • Waterlines (Water-from-Air)
      • Water Research (Water-from-Air)
      • Acta Hort. (Water-from-Air)
      • CWWA Conference 2014
    • Load Research (for BC Hydro)
    • Ice-scour tracks (Beaufort Sea)
  • Atmoswater Shop
  • Terms, Conditions, Privacy

Jackson, Mississippi Water-from-Air Resource Chart

14/9/2022

0 Comments

 
Picture of Water-from-Air Resource Chart for Jackson, Mississippi, USA
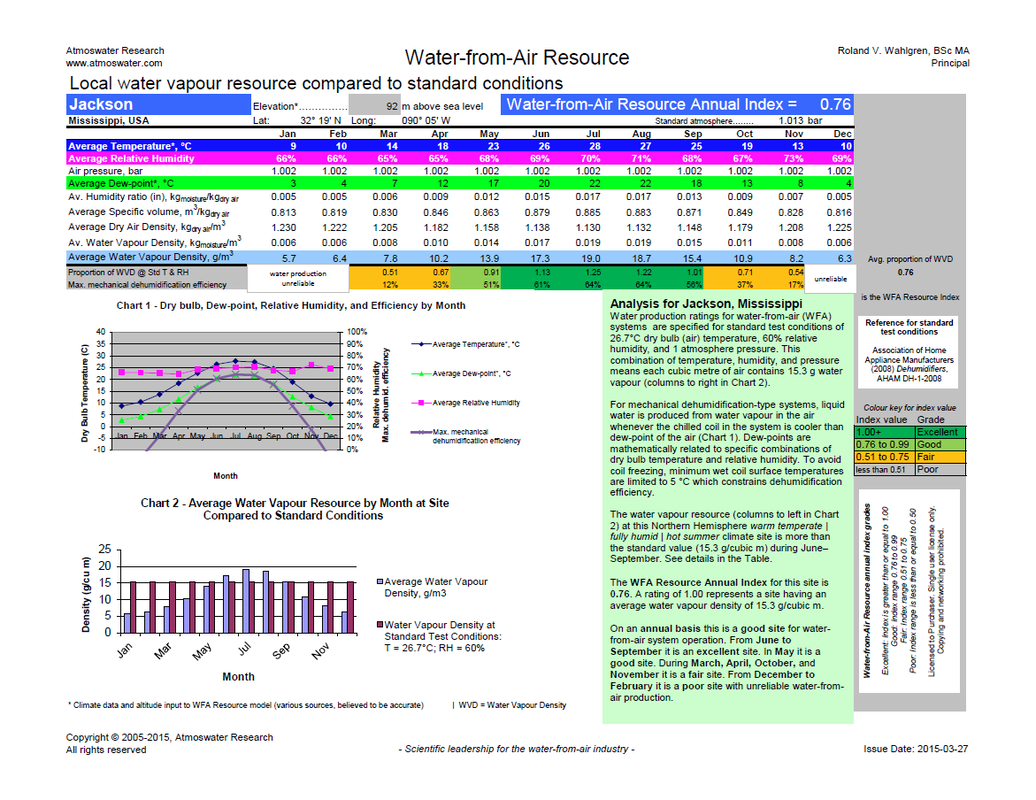
Water-from-Air Resource Chart for Jackson, Mississippi, USA. Click for larger image.
Some water-from-air system suppliers have shown interest in deploying their systems in Jackson.

The city's water system is not functioning properly following recent rains and flooding. Even before these events the water system was unreliable according to NBC News.

Is Jackson a good location for water-from-air systems? The Water-from-Air Resource Chart for Jackson grades the atmospheric water resource month-by-month. The chart is available as a free download. The monthly average dewpoint is 3 to 4 degrees C during December to February. Because these temperatures are close to the freezing point of water, some atmospheric water generator (AWG) designs may experience constraints on their water-from-air production capacity during these three months. For the balance of the year AWGs in Jackson should operate satisfactorily. See the chart for more information.
0 Comments

Water-from-Air Quick Guide updated July 2018!

1/8/2018

0 Comments

 
Picture
Water-from-Air Quick Guide
In response to a reader's comments, the July 2018 reprinted second edition incorporates enhanced temperature versus relative humidity psychrometric tables in Chapter 4 with wider temperature ranges (0–55 °C; 32–132 °F) for finding water vapour density, humidity ratio, and dew-point. This makes the tables more useful for cities like Abu Dhabi, Doha, and Dubai.

This reprint also has a revised Appendix 6: Economics of Off-grid Solar PV for WFA. There are two detailed examples in the Appendix. The first example is for a 1.05 kW input power atmospheric water generator using 1-phase electric power. The second example is for a 2.1 kW input power atmospheric water generator using 3-phase electric power.The Appendix presents clear diagrams showing the main components of single-phase and three-phase off-grid solar PV systems. The Appendix concludes by revealing, for each example, the ratio comparing the price of an off-grid solar PV system to the price of the atmospheric water generator.

The Water-from-Air Quick Guide may be purchased from Amazon. 
0 Comments

The #Water-from-Air Resource Chart Explained

5/3/2014

0 Comments

 
The Water-from-Air Resource Chart for Praia, Cape Verde
The Water-fom-Air Resource Chart for Praia, Cape Verde (click to enlarge).
Why use a Water-from-Air Resource Chart? Well, this colourful output from a computer model is a marvelous tool for understanding how well water-from-air machines (atmospheric water generators; AWGs) would perform at your location. "Knowledge is power"--there is value to being well-prepared before talking to equipment suppliers, consultants, or project colleagues.

Let me guide you through this information-packed chart.

  • Local water vapour resource compared to standard conditions: At standard conditions of 26.7° C dry bulb temperature and 60% relative humidity and 1 atmosphere air pressure (sea level) there is 15.3 grams of water vapour in every cubic metre of moist air. The local water vapour density (the resource) may be less, equal, or greater. By using a standard it is possible to compare one location to another, compare one month to another, compare one hour to another, and so on.
  • Elevation is an important input to the model because water vapour density normally decreases with altitude.
  • Latitude and longitude are for reference—usually water vapour density decreases with increasing latitude north or south (moving from the equator to the poles).
  • Monthly average temperatures for the location are obtained from various reliable sources.
  • Monthly average relative humidity values for the location are calculated by the model once it knows the monthly average dew-points.
  • Monthly average air pressures are calculated from the elevation information relative to the standard atmosphere at sea level which is 1.013 bar.
  • Humidity ratio, specific volume, and dry air density are intermediate values the model needs to calculate the average water vapour density in kilograms of moisture per cubic metre of air.
  • The highlighted-in-blue values of water vapour density have the units [g/cubic metre] to make the values easier to read and comprehend. A gram of water is represented by the 1 mL division on graduated cylinder laboratory glassware.
  • Proportion of water vapour density (WVD) at standard temperature (T) and relative humidity (RH) = (monthly average water vapour density) / (15.3 g/cubic m); This proportion is also called the index value.
  • Maximum mechanical dehumidification efficiency = [(average water vapour density - 6.8 g/cubic m)/(average water vapour density)] × 100%; Where 6.8 g/cubic m is the water vapour density of air at 5°C and 100% relative humidity at 1 atmosphere pressure—this models air leaving a wetted, unfrozen dehumidifier coil as being warmer than the freezing point of water and containing all the water vapour it can hold at the leaving temperature; The efficiency value is constrained to be less than 100% because in practice the coil temperature is regulated to 5­°C or above to prevent freezing of water onto the coil which causes overload and damage to the machine's compressor(s). An exploration of maximum efficiency for mechanical dehumidifiers is found in an earlier blog post.
  • Index value colours are applied to the index and efficiency values so the chart user can grasp at a glance the seasonal pattern of the water-from-air resource. The colour key and grade wording (excellent, good, fair, poor) for the index values is shown at the right-hand side of the page.
  • The annual index value is the average of the monthly index values. 
  • Chart 1 is a month-by-month graphical display of average values of temperature (dry bulb), dew-point, relative humidity, and efficiency.
  • Chart 2 is a month-by-month graphical display of average values of water vapour density (WVD; left blue columns) relative to the constant (right pink/red columns) standard condition WVD = 15.3 g/cubic metre.
  • An analysis section for the location enables each chart to be a stand-alone document with a concise explanations about standard conditions, the dehumidification process, and efficiency. This section also identifies the location's climate zone and expresses in words how effective a water-from-air machine would be at the site throughout the year.

Charts for many different locations are available from Atmoswater Research. You are welcome to ask me to produce charts for places of interest that are not listed yet.
0 Comments

    Roland Wahlgren

    I have been researching and developing drinking-water-from-air technologies since 1984. As a physical geographer, I strive to contribute an accurate, scientific point-of-view to the field.

    Discover previous interesting and informative scientific/technical posts by clicking "<<Previous" at the bottom of each page!

    Buy the
    Drinking-Water-from-Air Technology: Investor's Guide ("WFA 101").


    Archives

    December 2022
    September 2022
    August 2022
    December 2021
    November 2021
    September 2021
    October 2020
    August 2020
    July 2020
    April 2020
    March 2020
    February 2020
    November 2019
    October 2019
    September 2019
    August 2019
    April 2019
    November 2018
    October 2018
    September 2018
    August 2018
    July 2018
    June 2018
    May 2018
    March 2018
    August 2016
    June 2016
    March 2015
    November 2014
    September 2014
    July 2014
    March 2014
    February 2014
    January 2014
    December 2013
    October 2013
    September 2013
    August 2013
    July 2013
    June 2013
    May 2013
    April 2013
    March 2013
    February 2013
    January 2013
    December 2012
    October 2012
    September 2012
    August 2012
    June 2012
    April 2012
    April 2011
    March 2011
    January 2011

    Categories

    All
    Absorption Cooling
    Advertising
    Afghanistan
    Algeria
    American Samoa
    Anguilla
    Arizona
    Aruba
    Atlas
    Atmospheric Water Generator (AWG)
    Australia
    Azores
    Bahrain
    Belize
    Bermuda
    Brazil
    Business
    California
    Canary Islands
    Cape Verde
    Caribbean
    Case Studies
    Cayman Islands
    Chile
    China
    Colombia
    Condensate
    COVID 19
    COVID-19
    Cyprus
    Desalination
    Design
    Dew Point
    Dew-point
    Dominican Republic
    Drinking Water Industry
    Drought
    Efficiency
    Egypt
    Environmental Impact
    Finance
    Florida
    Gabon
    Ghana
    GHG-IQ
    Global Water Works Connect
    Healthcare Facilities
    Hong Kong
    Hourly Model
    Humidity Ratio
    India
    Indonesia
    Inventions
    Irrigation
    Israel
    Jackson
    Jamaica
    Jordan
    Kenya
    Kiribati
    Kuwait
    Libya
    Liquid Desiccant
    Load Research
    Malawi
    Malaysia
    Malta
    Markets
    Mauritius
    Metal Organic Framework
    Metal-organic Framework
    Mexico
    Mississippi
    Morocco
    Oklahoma
    Panama
    Patents
    Philippines
    Qatar
    Sanitation
    Schools
    SDG6
    Singapore
    Solar PV
    Spain
    Standard Test Conditions
    Sweden
    Texas
    Thermoelectric (Peltier)
    Tunisia
    Turks And Caicos Islands
    United Arab Emirates
    Venezuela
    Video Presentations
    Water Abundance XPrize
    Water Bottling
    Water Cost
    Water Crisis
    Water From Air
    Water-from-air
    Water Pseudo Science
    Water Quality
    Water Scarcity
    Water Science
    Water Vapor Density
    Wfa Hourly Analysis

    RSS Feed

    View my profile on LinkedIn
    Follow atmoswater on Twitter
    Tweets by @atmoswater
Copyright 1999–2023, Roland V. Wahlgren, Atmoswater™ Research. Atmoswater™ is a trademark claimed by Roland V. Wahlgren