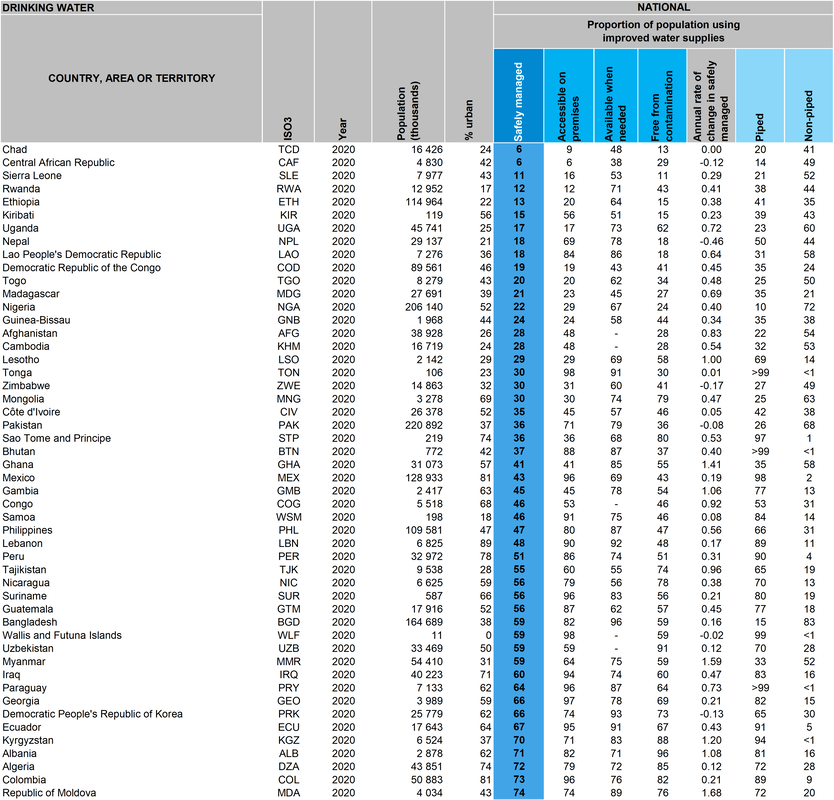
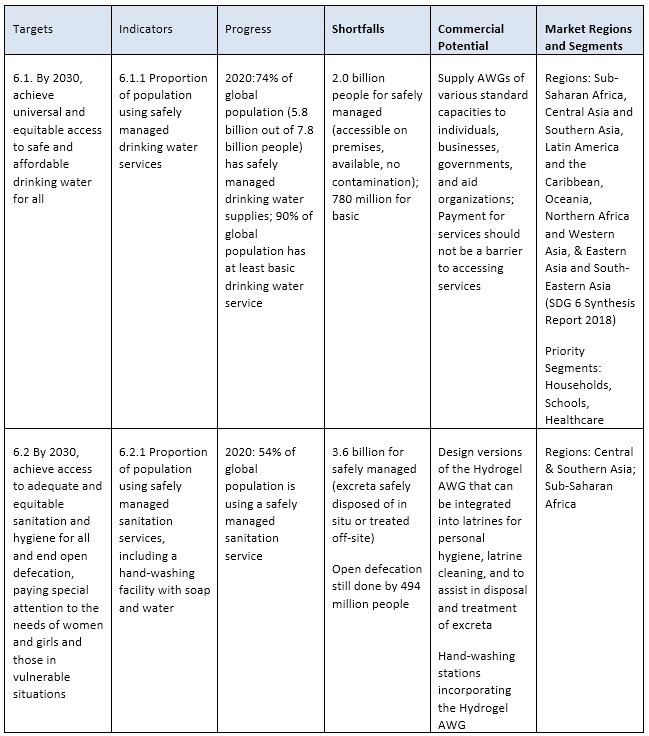
"Water from air" and "drought" search terms show an interesting positive correlation (r = 0.83) over the past 12 months---worth noting and delving into further. Also of interest are the top five countries where people used the search term "water from air" suggesting that technologies tapping directly into this water resource are indeed seen as viable solutions. Percentages are calculated out of searches for both terms in the country. Data source: Google Trends. Explore other relevant trends using the terms listed at our webpage, Water-from-Air Trends. The nine listed terms are classified as either problem-focused or solution-focused.
0 Comments
Some people prefer eBooks, others prefer printed books. Your choice!
Our latest publication is available as an eBook (PDF). This handbook includes active companies and tables detailing specifications of their atmospheric water generator products. You can order it at the Atmoswater Shop.
Peer-reviewed articles, even about water resources, can be a dry read. But not so for the recently published Open Access article, Increasing freshwater supply to sustainably address global water security at scale. Let me share four excerpts from the paper to inspire and energize us in the water-from-air community. The excerpts show we do indeed have a crucial role in improving access to drinking water.
- "...reducing and managing [water] demand are proving inadequate as population and economic growth quickly absorb any capacity that is created through these measures." - "Recycling and reuse of water...have limited scalability because they are fundamentally constrained by the available supply." - "Effective solutions to increase the [fresh water] supply are at present limited, or they are practically non-existent since all resources are being exploited beyond sustainable capacity or rapidly dwindling due to climate change." - "Desalination is not only energy intensive; it also creates concentrated brine and other byproducts that create significant environmental challenges with the cost of disposal." The authors proceed to outline their proposal for a system for siting water vapor collection systems above the surface of the ocean and then transporting the vapor to condensation systems on the nearby shore. They discuss the water vapor resource, the insignificant impact of climate change on viability of their system, the negligible environmental impact, and the financial feasibility. The research trio also claim their ocean-based system will benefit from a higher moisture flux compared to land-based water-from-air installations. The merits of the system outlined in the article remain to be validated but the important learnings from the article for those of us in the water-from-air industry are the quotations about the continuing inability of conventional water resources to provide global water security---thus giving incentive to our industry leadership to continue working diligently to prove the value of developing and commercializing water-from-air technologies. Reference Rahman, A., Kumar, P. & Dominguez, F. (2022). Increasing freshwater supply to sustainably address global water security at scale. Sci Rep 12, 20262 (2022). https://doi.org/10.1038/s41598-022-24314-2. This is an Open Access article. Here I refer again to statistics from UNICEF’s Water, Sanitation and Hygiene in Healthcare Facilities: Global Baseline Report 2019 which is found at: https://data.unicef.org/resources/wash-in-health-care-facilities/?mc_cid=f5b26e1fed&mc_eid=1956e675a7) The UNICEF report stated, “In 8 out of 55 countries with data available, more than half of health care facilities lacked handwashing facilities at points of care in 2016”. This is an urgent need that could be filled by appropriately designed AWGs. Today's post presents data about healthcare facilities with no handwashing facilities (Table 7, below). Table 7: Twelve countries, areas, or territories where more than half of healthcare facilities lacked handwashing facilities at points of care. This 2019 data is for 72 of 165 countries in the database. For 93 countries there is no data for hand hygiene materials at points of care. This table was condensed by the writer from a larger table. Data source: Progress on household drinking water, sanitation and hygiene 2000-2020: five years into the SDGs. Geneva: World Health Organization (WHO) and the United Nations Children’s Fund (UNICEF), 2021. Licence: CC BY-NC-SA 3.0 IGO. Data gaps are indicated by a dash (-). The detailed statistical table from which the tables are derived is too large to reproduce in this blog series. The detailed table is available at https://washdata.org/data/downloads (select “World File” under “Health Care Facilities”). Water service data is given for the following regional groupings of healthcare facilities:
This is the final post in this 7-part series about water-from-air market analyses based on the UN's Sustainable Development Goal 6 (Clean Water and Sanitation). Perhaps this series will inspire readers to initiate projects aligned with SDG 6. This alignment will create a demand for AWGs designed to address needs beyond household drinking water. AWGs are needed for household sanitation, basic water services in schools, handwashing in schools, basic water services in healthcare facilities, and healthcare handwashing facilities. Innovative business models are needed to allow water-from-air system suppliers to participate in achieving SDG 6 targets. Statistics from UNICEF’s Water, Sanitation and Hygiene in Healthcare Facilities: Global baseline report 2019 https://data.unicef.org/resources/wash-in-health-care-facilities/?mc_cid=f5b26e1fed&mc_eid=1956e675a7) show the commercial potential for AWGs in the healthcare facility market in two market segments:
An estimated 896 million people use health care facilities with no water service and 1.5 billion use facilities with no sanitation service. It is likely that many more people are served by health care facilities lacking hand hygiene facilities and safe waste management. Today's post presents data about healthcare facilities with no water service (Table 6, below). Table 6: Eighteen countries, areas, or territories have no water service in at least 20% of their healthcare facilities. This 2019 data is for 79 of 165 countries in the database. For 86 countries there is no data for no water service in healthcare facilities. This table was condensed by the writer from a larger table. Data source: Progress on household drinking water, sanitation and hygiene 2000-2020: five years into the SDGs. Geneva: World Health Organization (WHO) and the United Nations Children’s Fund (UNICEF), 2021. Licence: CC BY-NC-SA 3.0 IGO. Data gaps are indicated by a dash (-). Basic hygiene services in schools depends on clean water being available for handwashing. AWGs could be designed specifically for this application. Table 5 below shows the national statistics. The world file tables available at https://washdata.org/data/downloads also show urban and rural statistics so quite detailed market analyses are possible. Table 5: Forty-four countries, areas, or territories have school basic hygiene services less than 75% of the school age population. This data is for 121 out of 180 countries in the database. For 59 countries there is no data for school basic hygiene services. The blog author condensed and sorted the data according to lowest to highest national proportion of basic hygiene services. Data source: Progress on household drinking water, sanitation and hygiene 2000-2020: five years into the SDGs. Geneva: World Health Organization (WHO) and the United Nations Children’s Fund (UNICEF), 2021. Licence: CC BY-NC-SA 3.0 IGO. Data gaps are indicated by a dash (-). It is often said that children are our future. This truism may explain the special interest shown by WHO and UNICEF in compiling statistics about school drinking water services (Table 4, below) and school basic hygiene (Table 5, to be posted later in Part 5 of 7). There is commercial potential for AWGs designed for use in schools in drinking water and handwashing applications. Drinking water AWGs for schools and AWGs for handwashing by students are market segments rarely mentioned by academic researchers developing AWGs and by businesses offering AWG products. Welcome exceptions are the atmospheric drinking water fountain products by Hydrosphair and Skywell. The tables show the enormous potential for appropriately designed AWGs. These tables show the national statistics. The world file tables available at https://washdata.org/data/downloads also show urban and rural statistics so quite detailed market analyses can be done. Countries, areas, or territories with school drinking water services less than 75% of school age population are listed here in Table 4. Table 4: Forty-four countries, areas, or territories have school basic water services less than 75% of the school age population. This data is for 133 out of 180 countries in the database. For 47 countries there is no data for school basic water services. The blog author condensed and sorted the data according to lowest to highest national proportion of basic water services. Data source: Progress on household drinking water, sanitation and hygiene 2000-2020: five years into the SDGs. Geneva: World Health Organization (WHO) and the United Nations Children’s Fund (UNICEF), 2021. Licence: CC BY-NC-SA 3.0 IGO. Data gaps are indicated by a dash (-). There are seventy-two countries, areas, or territories in which less than 75% of the population lives in households having safely managed sanitation (Table 3, below). Safely managed sanitation has these two properties: improved sanitation facility not shared with other households and excreta are disposed of in situ or transported and treated off-site. Many countries in the drinking water list (Table in blog post 2 of 7) do not appear in the sanitation list (Table 3, below) because of gaps in the national sanitation data. The countries so affected do, however, have national statistics for “latrines and other”, “septic tanks”, and “sewer connections”. For the record, 16 countries were expected to be in both tables but were not (in order of lowest to highest national proportion of safely managed drinking water): Rwanda, Uganda, Afghanistan, Cambodia, Côte d’Ivoire, Pakistan, Congo, Tajikistan, Nicaragua, Guatemala, Wallis and Futuna Islands, Uzbekistan, Democratic People’s Republic of Korea, Kyrgyzstan, Albania, and Republic of Moldova. Surprisingly, the list in the Sanitation Table below contains some countries that are in the High-income group as defined by their nominal values of Gross National Income (GNI) per capita in 2020‒2021 [>US$12,695; Atlas method— indicator of income developed by the World Bank; Wikipedia: List of countries and dependencies by GNI (nominal) per capita, USD]. These high-income group countries with relatively great household sanitation challenges are: Australia; China, Macao SAR; Croatia; Norway; Saudi Arabia; and Slovenia. Because of their relatively high per capita income status, these countries are good initial marketing targets for versions of AWGs designed to provide clean water for sanitation applications. Table 3: Seventy-two countries, areas, or territories with household sanitation safely managed less than 75%. This data is for 120 out of 234 countries in the database. For 114 countries there is no data for safely managed household sanitation. The image is an excerpt from a larger table. The blog author condensed and sorted the data according to lowest to highest national proportion of safely managed. Data source: Progress on household drinking water, sanitation and hygiene 2000-2020: five years into the SDGs. Geneva: World Health Organization (WHO) and the United Nations Children’s Fund (UNICEF), 2021. Licence: CC BY-NC-SA 3.0 IGO. Data table downloads (Microsoft Excel® format) are available at https://washdata.org/data/downloads#. Some high-income countries are in this list (see text). Data gaps are indicated by a dash (-). In Table 1 (Blog post 1 of 7 in this series), the shortfall for safely managed drinking water is 2 billion people. The shortfall for safely managed sanitation is almost twice as many people, 3.6 billion. Why? To understand the commercial potential of AWGs and formulate marketing strategies it is crucial to know the reasons. In 2014, a blog post titled “Water and Sanitation for Health: Why is Progress Slow?” was published by Q. Wodon, Lead Economist, Education Sector, World Bank and C. T. Nkengne, Economist, Poverty Global Practice, World Bank Group
(https://blogs.worldbank.org/health/water-and-sanitation-health-why-progress-slow). Their main points help to answer why:
I have noted, over many years in the water-from-air field, that academic researchers and businesses are focused almost totally on providing potable water—sanitation gets mentioned rarely, if at all. But clean water is essential for personal hygiene for men, women, children, and infants—using polluted water or not having any water at all for sanitation applications has the potential for causing dreadful health problems. Designing versions of AWGs specifically for personal hygiene could be a competitive advantage that would also improve the quality of life for millions of people. Households, schools, and healthcare facilities are essential markets to focus on according to the WHO/UNICEF Joint Monitoring Program for Water Supply, Sanitation and Hygiene (JMP). JMP is the data-holding entity monitoring progress towards the SDG 6 targets. Other markets exist but those mentioned are global priorities for which improving water supplies will improve the lives of millions of people by 2030. To position an AWG technology to help solve global water scarcity problems quickly and efficiently it is wise to adopt the priority markets outlined in the data tables by the experts involved with JMP ( Table downloads at: https://washdata.org/data/downloads#). There are fifty countries, areas, or territories with data showing less than 75% of their population lives in households having safely managed drinking water (see Table 2 below). A safely managed water supply has all three of these properties: located on premises, available when needed and free from fecal and priority chemical contamination (WHO and UNICEF, 2017, p. 24). Households whose water supply lacks one or more of these properties are a commercial opportunity for AWGs. Examining the table at the national level reveals details about target markets. For example, in Uganda (seventh on the list, sorted by proportion of population using safely managed water supplies) only 17% of the population has water accessible on their premises. Despite this fact, water is available when needed for 73% of Ugandans. But, unfortunately, only 62% of people have access to water free from contamination. The statistics also show that only 23% of the improved water supply is piped—so decentralized water distribution solutions like AWGs are a good fit to the situation. The original full data tables, available from the WHO and UNICEF Joint Monitoring Program further organize the national data into its rural and urban components (https://washdata.org/data/downloads#). This allows AWG marketing strategy development to be quite efficient. Table 2: Fifty countries, areas, or territories with household drinking water supply safely managed less than 75%. This data is for 138 out of 234 countries in the database. For 96 countries there is no data for safely managed water supplies. The image is an excerpt from a larger table. The blog author condensed and sorted the data according to lowest to highest national proportion of safely managed. Data source: Progress on household drinking water, sanitation and hygiene 2000-2020: five years into the SDGs. Geneva: World Health Organization (WHO) and the United Nations Children’s Fund (UNICEF), 2021. Licence: CC BY-NC-SA 3.0 IGO. Data table downloads (Microsoft Excel® format) are available at https://washdata.org/data/downloads#. Data gaps are indicated by a dash (-). The commercial potential of atmospheric water generators (AWGs) can be evaluated in the framework of the United Nations Sustainable Development Goals (SDGs). These global goals were set in 2015 by a unanimous vote in the UN General Assembly. The goals are to be met by 2030. The SDGs relevant to water resources make plain the urgent demand for specific products and services. They also state market segments and geographical regions that must be addressed to improve the quality of life for millions of people. In short, the SDG documents contain global market survey results, outlining concisely the big-picture problems that innovative products and services must help solve. As a reminder, and to put the water-related SDG in context, here is list of the seventeen SDGs (https://www.un.org/sustainabledevelopment/sustainable-development-goals/): 1. No Poverty 2. Zero Hunger 3. Good Health and Well-being 4. Quality Education 5. Gender Equality 6. Clean Water and Sanitation 7. Affordable and Clean Energy 8. Decent Work and Economic Growth 9. Industry, Innovation, and Infrastructure 10. Reduced Inequalities 11. Sustainable Cities and Communities 12. Responsible Consumption and Production 13. Climate Action 14. Life Below Water 15. Life on Land 16. Peace, Justice, and Strong Institutions 17. Partnerships for the Goals Each goal has a list of targets. Indicators measure progress towards achieving targets. The SDG relevant to AWG design is Goal 6, Clean Water and Sanitation. The following Table 1 is my interpretation of how SDG 6 targets translate into insights about commercial potential for AWGs and the market segments to be addressed. These insights may influence design paths taken towards the final commercial versions of AWGs. There is a lot to say about this topic, so I've prepared seven blog posts to be published as a series.
My goal is to remind readers of the scope of the water crisis. No single technology can hope to end the crisis. Solving water scarcity requires a variety of solutions applied thoughtfully region by region. Some powerful solutions are behavioral (and therefore essentially free of any cost in the long term). One example is reduction or elimination of mismanagement of surface water and groundwater. Another example is increased water conservation by individuals, businesses, and institutions. Some solutions are related to maintenance of water distribution infrastructure that should really be done anyway but require leadership and political willpower to include sufficient maintenance funds in budgets. A variety of technological solutions are also likely to be needed. Water-from-air can be a valuable gap-filler in situations where conventional water supply or conventional sanitation solutions are difficult to apply or have failed. The SDG 6-related data tables in the following posts reflect these difficulties and failures. Clearly, proponents of water-from-air technologies have an enormous range of water scarcity problems to help solve. The second blog post will look at national data for safely managed household drinking water. Recently, I was catching up on my reading. An article's title caught my attention---Redirect military budgets to climate and pandemics (Nature, V 584, 27 August 2020, 521-523)---I know, I know, this article was a year old---my catch-up pile is rather high! The author was Denise Garcia, associate professor of political science and international affairs at Northeastern University, Boston, MA. She is also a vice-chair of the International Committee for Robot Arms Control, and a member of the International Panel for the Regulation of Autonomous Weapons. Garcia's article is worth reading in its entirety. But, what spoke to me was her list of four priorities, one of which is relevant directly to the water-from-air industry. The four priorities are: stop new arms races, abide by the Arms Trade Treaty, implement the 2015 Paris climate agreement, and invest in the United Nations Sustainable Development Goals (SDGs, agreed to in 2015). SDG 6 is Ensure access to water and sanitation for all. Atmoswater Research, in its own low-key way---evidenced by the content of the Atmoswater website and list of projects done for clients over the years---is trying to contribute to SDG 6. In so doing, we can claim to be part of the four priorities------helping, as Garcia said, "...steer the world towards a safer course." I like to be inspired by this role, especially when the going gets tough, as it so often does.
This quotation defines the fundamental market for the water-from-air industry.
"The pandemic has exposed huge inequalities in water security, with more than 2 billion people, half of schools, and one-quarter of health-care facilities lacking a basic water or sanitation service."---as stated by 16 co-signatories in Correspondence published in Nature 583, 360 (2020). But, it is challenging to develop business models to address these markets in which the individual members seldom can afford innovations. Although technical water-from-air advancements remain important to work on, the need for business model inventiveness is likely to be even more necessary. |
Roland Wahlgren
I have been researching and developing drinking-water-from-air technologies since 1984. As a physical geographer, I strive to contribute an accurate, scientific point-of-view to the field. Archives
November 2024
Categories
All
|