Atmoswater Research
+1 604-985-3720
  • Home
  • Atmoswater Blog
  • About
  • Contact
  • Books (HVAC&R)
    • Water-from-Air Book
  • Useful Lists
    • Manufacturers and Suppliers of Atmospheric Water Generators & Water-from-Air Machines
    • Case Studies About Water-from-Air
    • Atmospheric Water Generator or Water-from-Air Machine Market Research Links
    • Projects about Water-from-Air
    • Articles about Water-from-Air >
      • ScienceDaily Article Links
    • Patents about Water-from-Air and Atmospheric Water Generators
    • Water Lexicon
  • Links, FAQ, & Video
    • Drinking-water Industry Organizations Links
    • Map of the Water-from-Air Resource
    • Topic Links for Water-from-Air
    • Trends for Water-from-Air
    • Water Industry News Links
    • Water Organizations Links
    • Water-from-Air FAQ
    • Video about Water-from-Air
  • Scientific & Technical Consulting
    • Consulting Physical Geographer
    • Research Services in Climatology, Geomorphology, Hydrology, and Oceanography
    • Translations of Scientific and Technical Documents (Swedish, French)
    • Projects >
      • Our Projects
      • Atmospheric Water Vapour Processing (AWVP)
    • Publications by Roland Wahlgren >
      • Publications List for Roland Wahlgren
      • GSC 77-1A (Beaufort Sea Sediment Cores)
      • M.A. Thesis (Beaufort Sea Ice-scour Tracks)
      • GSC 79-1B (Beaufort Sea Ice-scour Tracks)
      • Waterlines (Water-from-Air)
      • Water Research (Water-from-Air)
      • Acta Hort. (Water-from-Air)
      • CWWA Conference 2014
    • Load Research (for BC Hydro)
    • Ice-scour tracks (Beaufort Sea)
  • Atmoswater Shop
  • Terms, Conditions, Privacy

#CaDrought and the Water-from-Air System Hourly Analysis Model

6/3/2014

2 Comments

 
A Water-from-Air System Hourly Analysis Model for San Francisco, California is available as a free download on the Atmoswater Research website. During the prevailing California Drought, seventeen rural communities were identified by the California Department of Public Health as having "drinking water systems at greatest risk". Two of the affected counties, Sonoma and Santa Cruz are adjacent north and south respectively to San Francisco. Therefore, it is interesting to take a tour through the San Francisco hourly analysis model to see what it can tell us about the feasibility of using water-from-air machines (atmospheric water generators) as alternative or additional water resources in drought affected communities in Sonoma and Santa Cruz.
Tour Stop 1
Water-from-Air System Hourly Analysis Model (cover)
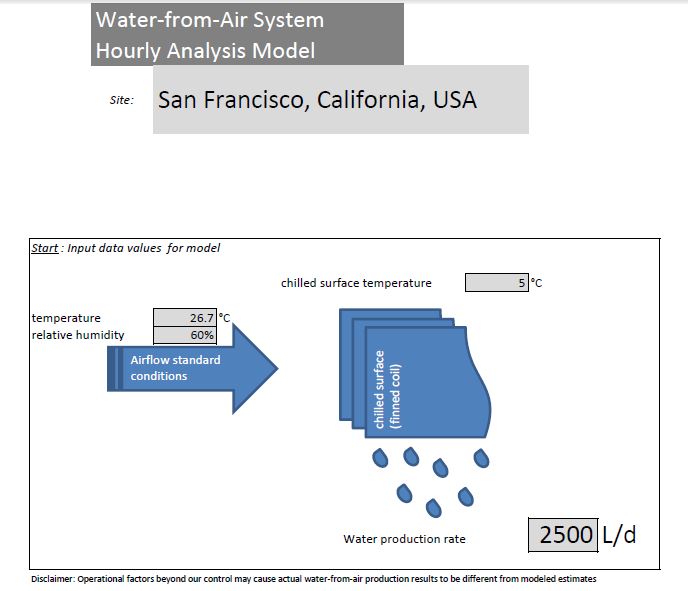
Tour Stop 1: Input values include the water-from-air machine's water production rate at a specific combination of temperature and relative humidity. The chilled surface temperature is also used as a model input value. (Click to enlarge)
Tour Stop 2
Daily Water Production
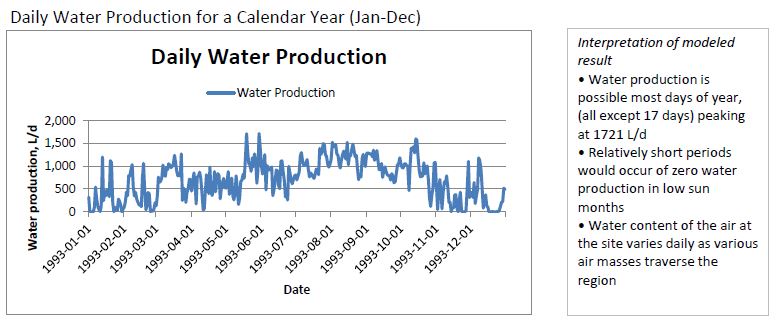
Tour Stop 2: Daily Water Production graph with an interpretation of the modeled result, (Click to enlarge)
Tour Stop 3
Daily Average Water Production by Month
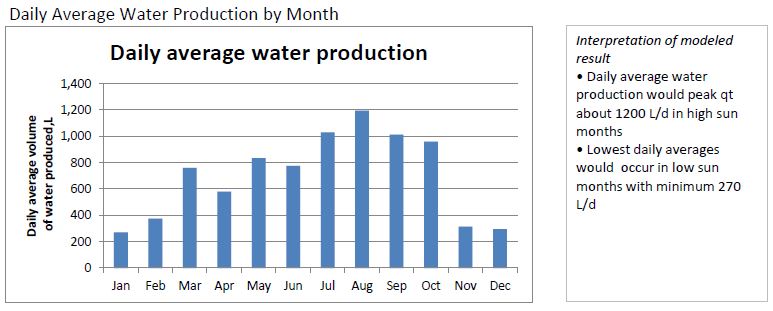
Tour Stop 3: Daily Average Water Production by Month with an interpretation of the modeled result. In a water crisis situation, each person needs 5 L/day of drinking water. Total daily water demand per person to take care of their drinking, cooking, sanitation, and bathing needs is typically 50 L/day. (Click to enlarge)
Tour Stop 4
Hourly Water Production Rate Annual Frequency Distribution
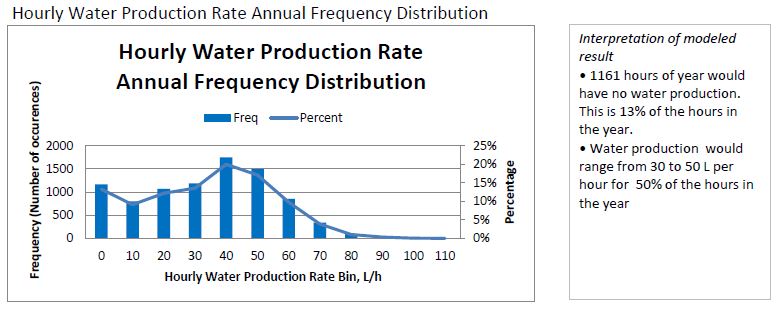
Tour Stop 4: Hourly Production Rate Annual Frequency Distribution with an interpretation of the modeled result. (Click to enlarge)
Tour Stop 5
Output data
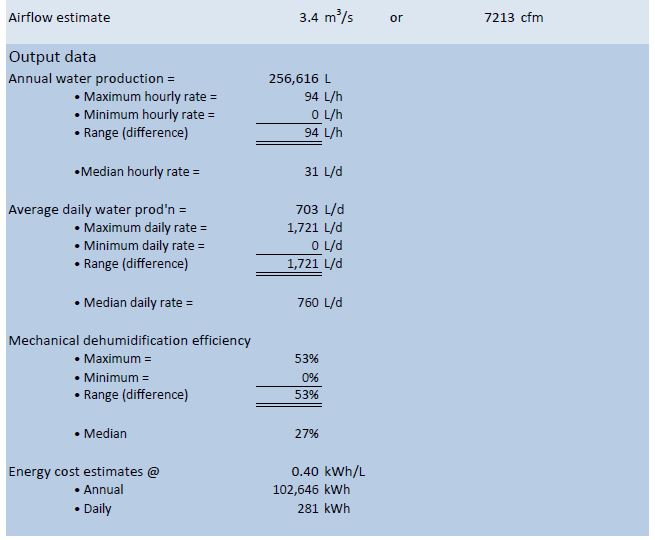
Tour Stop 5: With an average daily water production of 703 L/d, one machine could serve 14 people at the 50 L/d level or 140 people at the minimal 5 L/d level of drinking water consumption. Water storage is needed to distribute the annual water production evenly over the year. Several machines can be distributed throughout a region to serve larger populations. Water-from-air is a unique decentralized way of obtaining water. It is not absolutely necessary to think of a central water production hub. The machines can be placed where they are needed.
Tour Stop 6
Core of model
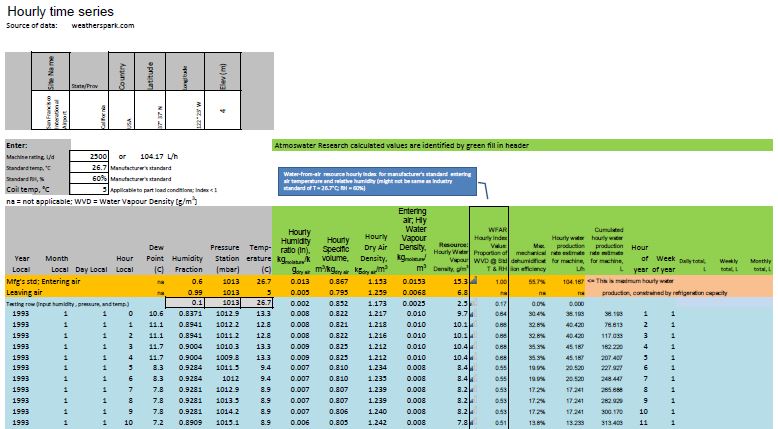
Tour Stop 6: The core of the model with hourly input and output values. (Click to enlarge)
Tour Stop 7
Daily Water Production table excerpt
Tour Stop 7: This is an excerpt from the daily water production table that is generated from the hourly weather data. The hourly air temperature, relative humidity, and air pressure values enabled calculation of the hourly water vapour density (the water resource).
Tour Stop 8
Diurnal Water Production - March 21
Diurnal Water Production - June 21
Diurnal Water Production - Sept 23
Diurnal Water Production - Dec 28
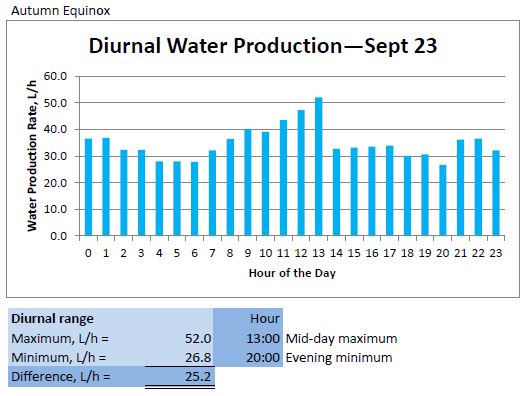
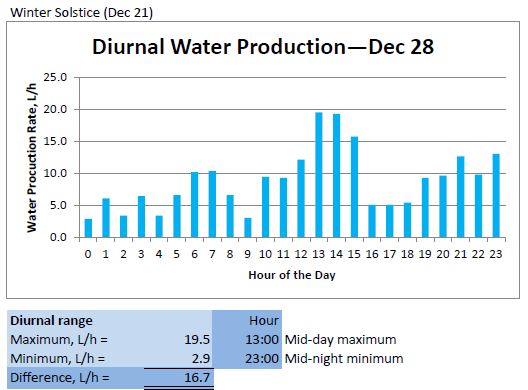
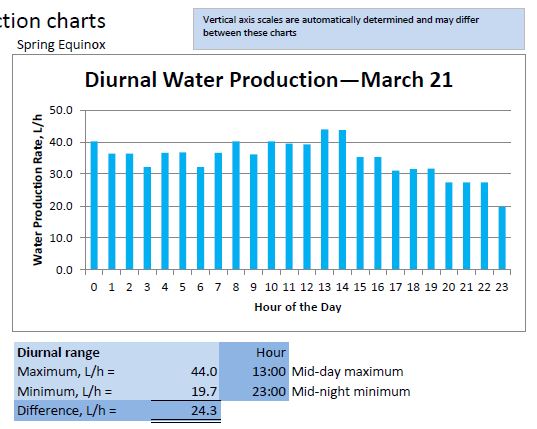
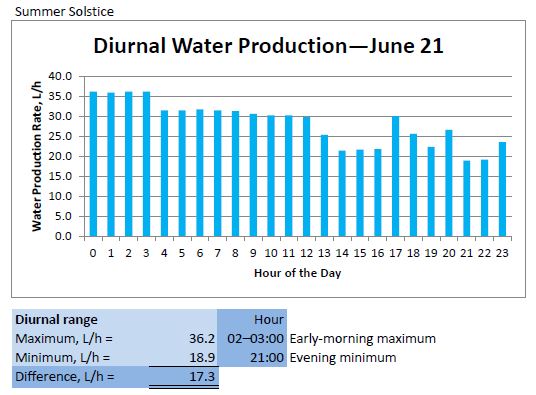
Tour Stop 8: In San Francisco, the diurnal regime of the water-from-air resource is somewhat variable with the seasons. (Click on images to enlarge them)
I hope you found this tour interesting!  The entire model output consists of 120 pages. Becoming familiar with how a water-from-air machine responds with its freshwater production to the hourly weather at a site is a unique experience that really helps make sound decisions about whether or not to use these machines in various drought situations.

The San Francisco model shown here used weather data from 1993 because that was available as a free sample from a weather data vendor. Given the realities of climate change it would be interesting to run the model with 2013 data.

I can run models for key drought locations in California. The price per model run report is [ask for quote] (USD). Please allow up to five business days for delivery as a PDF download.
2 Comments
Girja Sharan link
6/3/2014 07:29:33 pm

Simulation with actual data is very informative. Thanks .
It occurred to me like if controls were added such that the water generator will shut itself off when conditions are ( temp and RH) not favorable for high rate of production and come on again when it is. Like the 1166 hrs in this case. Does the chiller continue to operate during these hours?
Will such a control ( easy to implement) help reduce energy use?
Again , thanks . It is very useful stuff.

Reply
Roland Wahlgren link
7/3/2014 02:51:17 am

I am aware that Air to Water Technologies, Inc. uses a method they call Dew Point Intelligence to accomplish this type of control in their machines. For more information see http://www.airtowatertech.com/technology/dewpoint.html.

Whether or not the chiller would continue to operate would depend on the control design. Clearly, it is better to shut down any component possible that consumes energy during unfavourable conditions for water production. This would reduce energy use and result in a lower energy cost for the water that is produced. An apt analogy might be a gasoline powered automobile that turns itself off at stop lights or when stopped in traffic congestion. The fuel consumption value [litres per km (or miles per gallon)] is going to be minimized.

Reply


Leave a Reply.

    Roland Wahlgren

    I have been researching and developing drinking-water-from-air technologies since 1984. As a physical geographer, I strive to contribute an accurate, scientific point-of-view to the field.

    Discover previous interesting and informative scientific/technical posts by clicking "<<Previous" at the bottom of each page!

    Buy the
    Drinking-Water-from-Air Technology: Investor's Guide ("WFA 101").


    Archives

    December 2022
    September 2022
    August 2022
    December 2021
    November 2021
    September 2021
    October 2020
    August 2020
    July 2020
    April 2020
    March 2020
    February 2020
    November 2019
    October 2019
    September 2019
    August 2019
    April 2019
    November 2018
    October 2018
    September 2018
    August 2018
    July 2018
    June 2018
    May 2018
    March 2018
    August 2016
    June 2016
    March 2015
    November 2014
    September 2014
    July 2014
    March 2014
    February 2014
    January 2014
    December 2013
    October 2013
    September 2013
    August 2013
    July 2013
    June 2013
    May 2013
    April 2013
    March 2013
    February 2013
    January 2013
    December 2012
    October 2012
    September 2012
    August 2012
    June 2012
    April 2012
    April 2011
    March 2011
    January 2011

    Categories

    All
    Absorption Cooling
    Advertising
    Afghanistan
    Algeria
    American Samoa
    Anguilla
    Arizona
    Aruba
    Atlas
    Atmospheric Water Generator (AWG)
    Australia
    Azores
    Bahrain
    Belize
    Bermuda
    Brazil
    Business
    California
    Canary Islands
    Cape Verde
    Caribbean
    Case Studies
    Cayman Islands
    Chile
    China
    Colombia
    Condensate
    COVID 19
    COVID-19
    Cyprus
    Desalination
    Design
    Dew Point
    Dew-point
    Dominican Republic
    Drinking Water Industry
    Drought
    Efficiency
    Egypt
    Environmental Impact
    Finance
    Florida
    Gabon
    Ghana
    GHG-IQ
    Global Water Works Connect
    Healthcare Facilities
    Hong Kong
    Hourly Model
    Humidity Ratio
    India
    Indonesia
    Inventions
    Irrigation
    Israel
    Jackson
    Jamaica
    Jordan
    Kenya
    Kiribati
    Kuwait
    Libya
    Liquid Desiccant
    Load Research
    Malawi
    Malaysia
    Malta
    Markets
    Mauritius
    Metal Organic Framework
    Metal-organic Framework
    Mexico
    Mississippi
    Morocco
    Oklahoma
    Panama
    Patents
    Philippines
    Qatar
    Sanitation
    Schools
    SDG6
    Singapore
    Solar PV
    Spain
    Standard Test Conditions
    Sweden
    Texas
    Thermoelectric (Peltier)
    Tunisia
    Turks And Caicos Islands
    United Arab Emirates
    Venezuela
    Video Presentations
    Water Abundance XPrize
    Water Bottling
    Water Cost
    Water Crisis
    Water From Air
    Water-from-air
    Water Pseudo Science
    Water Quality
    Water Scarcity
    Water Science
    Water Vapor Density
    Wfa Hourly Analysis

    RSS Feed

    View my profile on LinkedIn
    Follow atmoswater on Twitter
    Tweets by @atmoswater
Copyright 1999–2023, Roland V. Wahlgren, Atmoswater™ Research. Atmoswater™ is a trademark claimed by Roland V. Wahlgren