Regional droughts in the Caribbean are common. Water managers seeking solutions to water scarcity are often unfamiliar with the option of using water-from-air technology. Maps of the specific humidity composite mean for Junes and Decembers during the ten-year period 2004–2013 quantify the water-from-air resource demonstrating it is suitable for operation of water-from-air systems in Caribbean countries. Quantitative investigations by the author found droughts and long-term climate change do not appear to affect the magnitude of the Caribbean region’s water-from-air resource. Case studies include one for a proposed water-from-air commercial greenhouse on Grand Turk. Another case is about the experience of commissioning a 2500 L/d water-from-air machine in Belize City. Lessons learned from the case studies are outlined.
I have the privilege of being accepted as one of the presenters during the Technical Sessions at the 23rd Annual Caribbean Water and Wastewater Association (CWWA) Conference and Exhibition scheduled for October 6-10, 2014 at Atlantis Resorts on Paradise Island, Bahamas. Here is the Abstract of my paper:
Regional droughts in the Caribbean are common. Water managers seeking solutions to water scarcity are often unfamiliar with the option of using water-from-air technology. Maps of the specific humidity composite mean for Junes and Decembers during the ten-year period 2004–2013 quantify the water-from-air resource demonstrating it is suitable for operation of water-from-air systems in Caribbean countries. Quantitative investigations by the author found droughts and long-term climate change do not appear to affect the magnitude of the Caribbean region’s water-from-air resource. Case studies include one for a proposed water-from-air commercial greenhouse on Grand Turk. Another case is about the experience of commissioning a 2500 L/d water-from-air machine in Belize City. Lessons learned from the case studies are outlined.
0 Comments
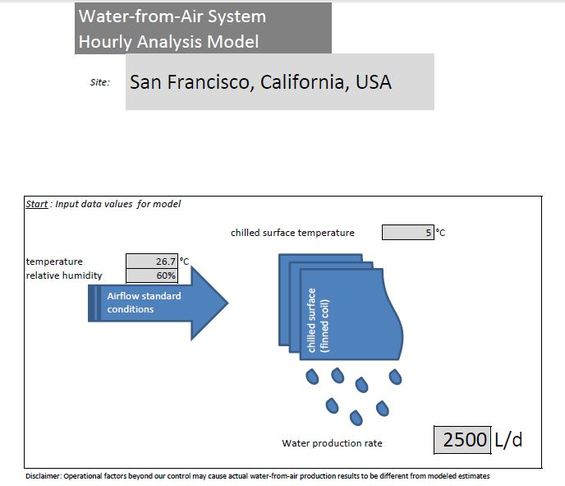
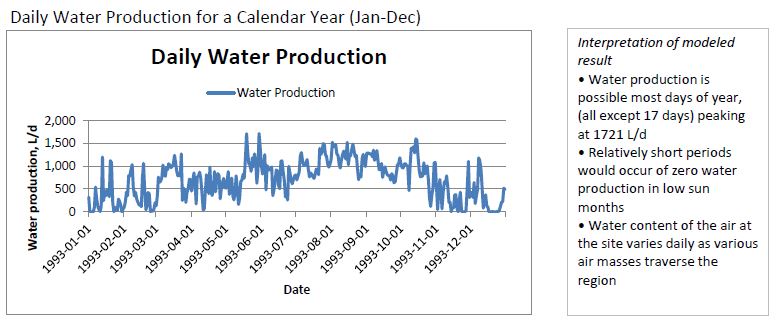
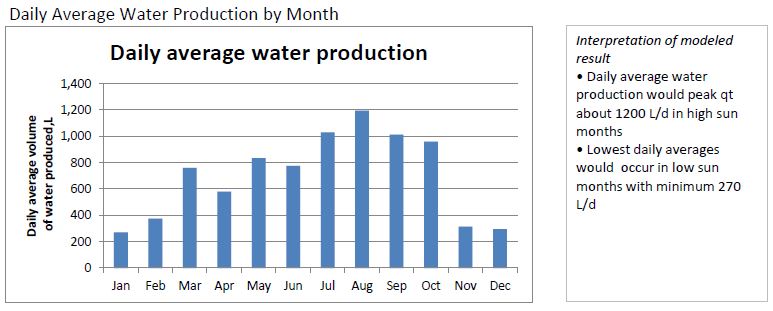
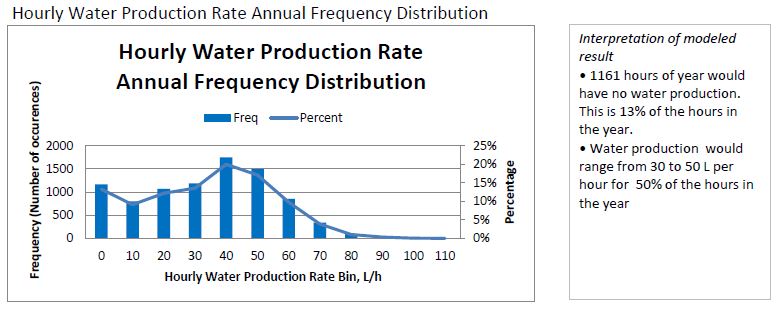
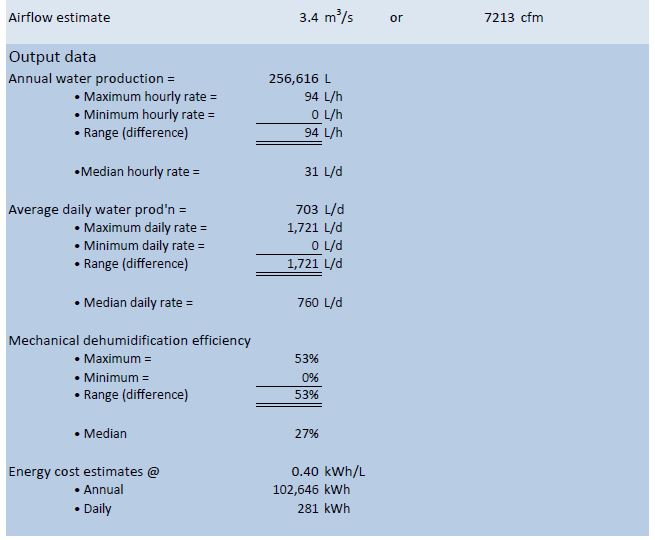
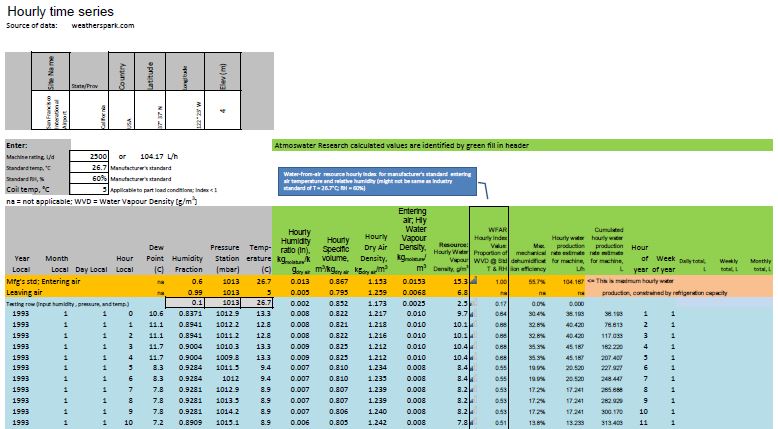
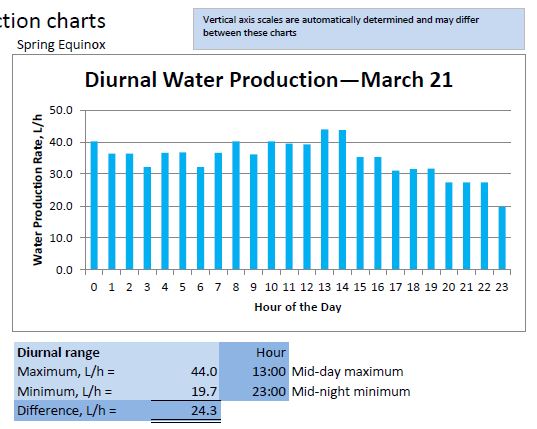
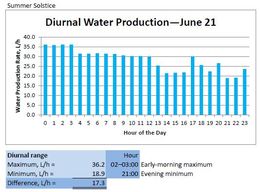
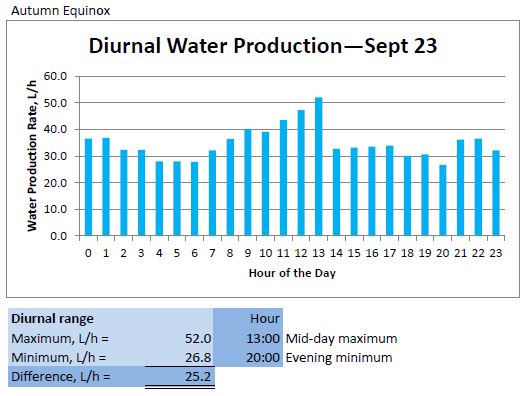
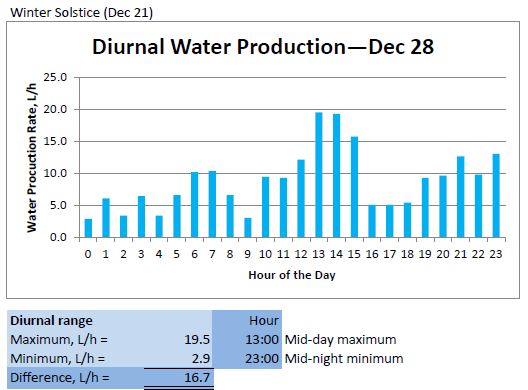
A Water-from-Air System Hourly Analysis Model for San Francisco, California is available as a free download on the Atmoswater Research website. During the prevailing California Drought, seventeen rural communities were identified by the California Department of Public Health as having "drinking water systems at greatest risk". Two of the affected counties, Sonoma and Santa Cruz are adjacent north and south respectively to San Francisco. Therefore, it is interesting to take a tour through the San Francisco hourly analysis model to see what it can tell us about the feasibility of using water-from-air machines (atmospheric water generators) as alternative or additional water resources in drought affected communities in Sonoma and Santa Cruz. Tour Stop 1 Tour Stop 2 Tour Stop 3 ![]() Tour Stop 3: Daily Average Water Production by Month with an interpretation of the modeled result. In a water crisis situation, each person needs 5 L/day of drinking water. Total daily water demand per person to take care of their drinking, cooking, sanitation, and bathing needs is typically 50 L/day. (Click to enlarge) Tour Stop 4 Tour Stop 5 ![]() Tour Stop 5: With an average daily water production of 703 L/d, one machine could serve 14 people at the 50 L/d level or 140 people at the minimal 5 L/d level of drinking water consumption. Water storage is needed to distribute the annual water production evenly over the year. Several machines can be distributed throughout a region to serve larger populations. Water-from-air is a unique decentralized way of obtaining water. It is not absolutely necessary to think of a central water production hub. The machines can be placed where they are needed. Tour Stop 6 Tour Stop 7 Tour Stop 8 Tour Stop 8: In San Francisco, the diurnal regime of the water-from-air resource is somewhat variable with the seasons. (Click on images to enlarge them) I hope you found this tour interesting! The entire model output consists of 120 pages. Becoming familiar with how a water-from-air machine responds with its freshwater production to the hourly weather at a site is a unique experience that really helps make sound decisions about whether or not to use these machines in various drought situations.
The San Francisco model shown here used weather data from 1993 because that was available as a free sample from a weather data vendor. Given the realities of climate change it would be interesting to run the model with 2013 data. I can run models for key drought locations in California. The price per model run report is [ask for quote] (USD). Please allow up to five business days for delivery as a PDF download. ![]() Abstract from my article published February 11, 2014 on Water Online: Quantifying the water-from-air resource enables targeting selected cities where installing strategically located stand-alone processors of atmospheric water vapor will have the quickest, most beneficial impact for people facing water scarcities. Today, I have a guest post from Walter Wallie Ivison, Director and CEO of World Environmental Solutions, Australia. As usual, Atmoswater Research is not responsible for the contents of external links. While most of us accept water in a similar way to the air we breathe, water still remains one of the concerns for most of the world's population illustrated by the number of hits on Google these days on ways to get water; 300,000 a month on water from the atmosphere is a good example. As we continue to pollute our waters, less fresh water is becoming available for us to drink. More rivers, lakes, and underground aquifers are drying up as the years pass. As bodies of water around the world continue to dry up, we’re seeing more drought conditions spread. There are dust storms in places which have never experienced them until now. As time flows, the amount of agricultural land shrinks, and deserts are growing. |
Roland Wahlgren
I have been researching and developing drinking-water-from-air technologies since 1984. As a physical geographer, I strive to contribute an accurate, scientific point-of-view to the field. Archives
December 2021
Categories
All
|