 Go to article by clicking on image.
|
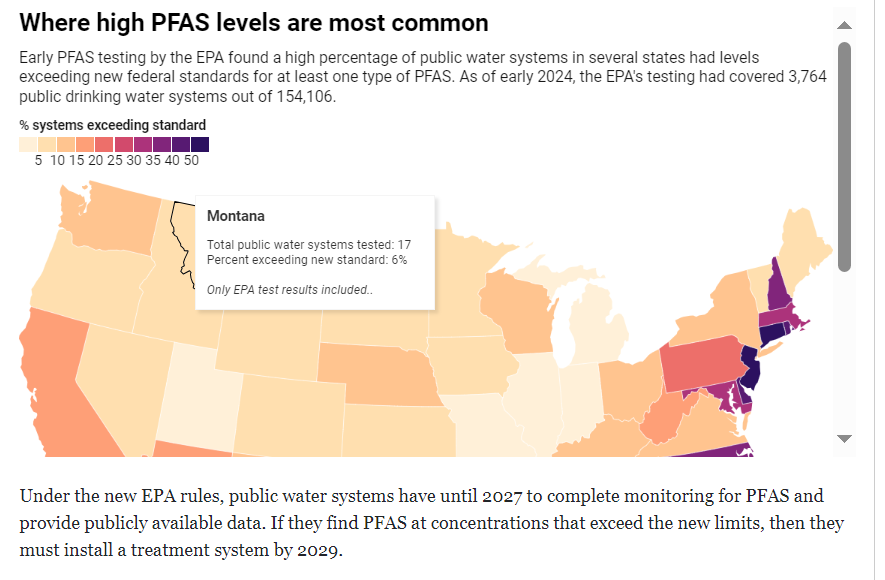
If you sell AWGs, I think the interactive map accompanying this Water Online article could serve as a useful guide for where to focus AWG marketing efforts in the USA.  Go to article by clicking on image. Go to article by clicking on image.
0 Comments
Some people prefer eBooks, others prefer printed books. Your choice!
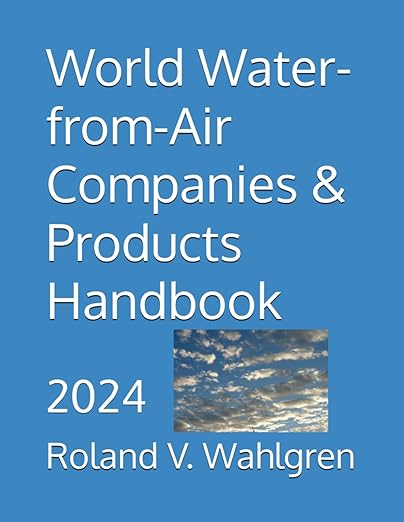
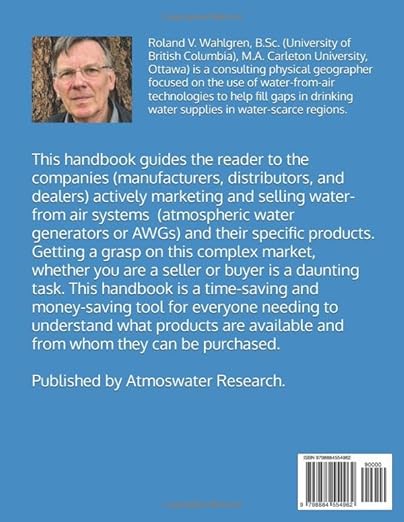
Our latest publication is available as an eBook (PDF). This handbook includes active companies and tables detailing specifications of their atmospheric water generator products. You can order it at the Atmoswater Shop.
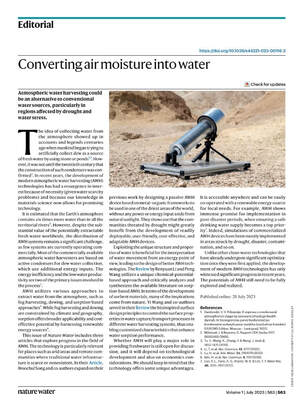
Water-from-air technologies are attracting serious attention as shown by a recent editorial in the journal Nature Water. Highlights from the editorial include:
[Text excerpted and adapted from Technical Bulletin No. 5 (revised 2023)—Environmental impact of widespread use of drinking-water-from-air systems issued by Canadian Dew Technologies Inc. This blog post supersedes two earlier blog posts on the same topic (My answers to questions asked in Oct. 20, 2020 Webinar: Introduction to Atmospheric Water and Impact on the atmospheric water reservoir from using water-from-air systems: an update) The human population keeps increasing and estimates have been refined of the atmospheric water reservoir volume. Concern has been expressed by some potential users of WFA systems that widespread use in a region could decrease the water vapour content of the atmosphere. If this was the case, would regional weather and climate be affected? Assessing Environmental Impact on the Atmospheric Water Reservoir Earth’s estimated human population is now 8 billion, projected to increase to 10.4 billion in 2100 (https://population.un.org/dataportal/home) so the 1993 worst-case impact estimate was updated as follows in the next paragraph, incorporating a revised per capita water consumption value of 50 L/day as suggested by Gleick (1998) for domestic water requirements (drinking, kitchen, laundry, and bath). Revised water cycle information was from Abbott et al. (2019). The atmosphere contains 12.9 × 10^12 m^3 of water or 0.001% of the Earth’s total water reservoir volume of 1.38 × 10^18 m^3. Water reservoirs include the atmosphere, ice and snow, biomass, surface water, underground water, and the oceans. Even if all 8 × 10^9 people on Earth used water from water vapour processors at the rate of 50 litres per day, they would consume only 0.003% of the available atmospheric water. In 2100, when population is expected to rise to 10.4 × 10^9, this worst-case impact would rise slightly to 0.004%. Water vapour, the gas phase of water, diffuses along pressure gradients to zones of lower water vapour pressure. If a lot of water vapour was condensed into liquid water in a specific region such as a city, water vapour from outside the region would flow into the region. No net loss of atmospheric water vapour would be observed in the city. Water consumed for domestic water requirements does not exit from the water cycle. Within a day the water that is used or temporarily withheld from the water cycle would be returned to the environment to evaporate into atmospheric water vapour. Quantifying the Direct Environmental Impact of Dehumidifiers and Air-Conditioners on the Atmospheric Water Reservoir An unintentional experiment has in fact already been running for the past 70 years. This experiment allows us to quantify the environmental impact to date of the human population processing atmospheric water vapour on a grand scale. Since about 1950 the widespread use of dehumidifiers and air-conditioners across the globe has resulted already in vast volumes of condensate dripping from millions of machines. In fact, Wikipedia: Air Conditioning (https://en.wikipedia.org/wiki/Air_conditioning) stated, "According to the IEA [International Energy Agency], as of 2018, 1.6 billion air conditioning units were installed...." The same Wikipedia article said, "Innovations in the latter half of the 20th century allowed for much more ubiquitous air conditioner use. In 1945, Robert Sherman of Lynn, Massachusetts invented a portable, in-window air conditioner that cooled, heated, humidified, dehumidified, and filtered the air." Has this experiment affected, in the long-term, the amount and geographical distribution of water vapour in the atmosphere? An analysis using data available from NOAA suggests not. Figure 1 shows the difference field of specific humidity resulting from subtracting the composite means (Jan to Dec) for the 10-year period 1948 to 1957 from the 20-year period 2013 to 2022. Surprisingly, several regions of increased specific humidity +1 to +2 g/kg are noticeable along Earth’s Tropical Belt. The increased water vapour content of the atmosphere is likely linked to global warming causing increased evaporation. Drying of about -2 to -3 g/kg is associated with the eastern Sahara and the Gobi deserts—more likely to be related to climate change than use of air-conditioning equipment in these sparsely populated areas. For most of Earth’s surface, specific humidity has been remarkably stable (+/-1 g/kg) over the past seven decades. 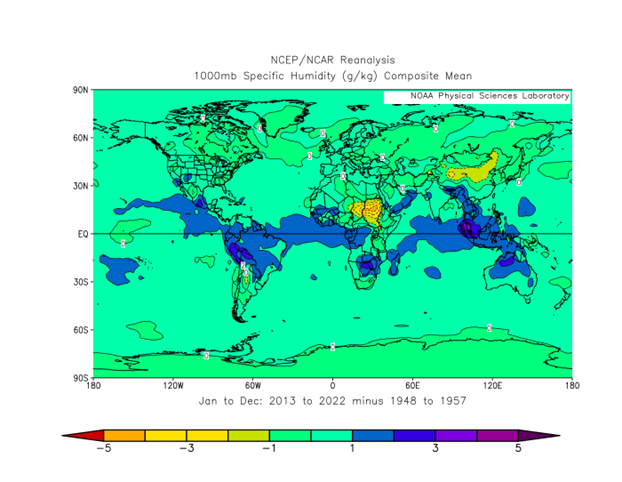 Figure 1. The difference field of specific humidity resulting from subtracting the composite means (Jan to Dec) for the 10-year period 1948 to 1957 from the 10-year period 2013 to 2022. Reference: NCEP Reanalysis Derived data provided by the NOAA/OAR/ESRL PSL, Boulder, Colorado, USA, from their website at https://psl.noaa.gov/ Precipitation Enhancement
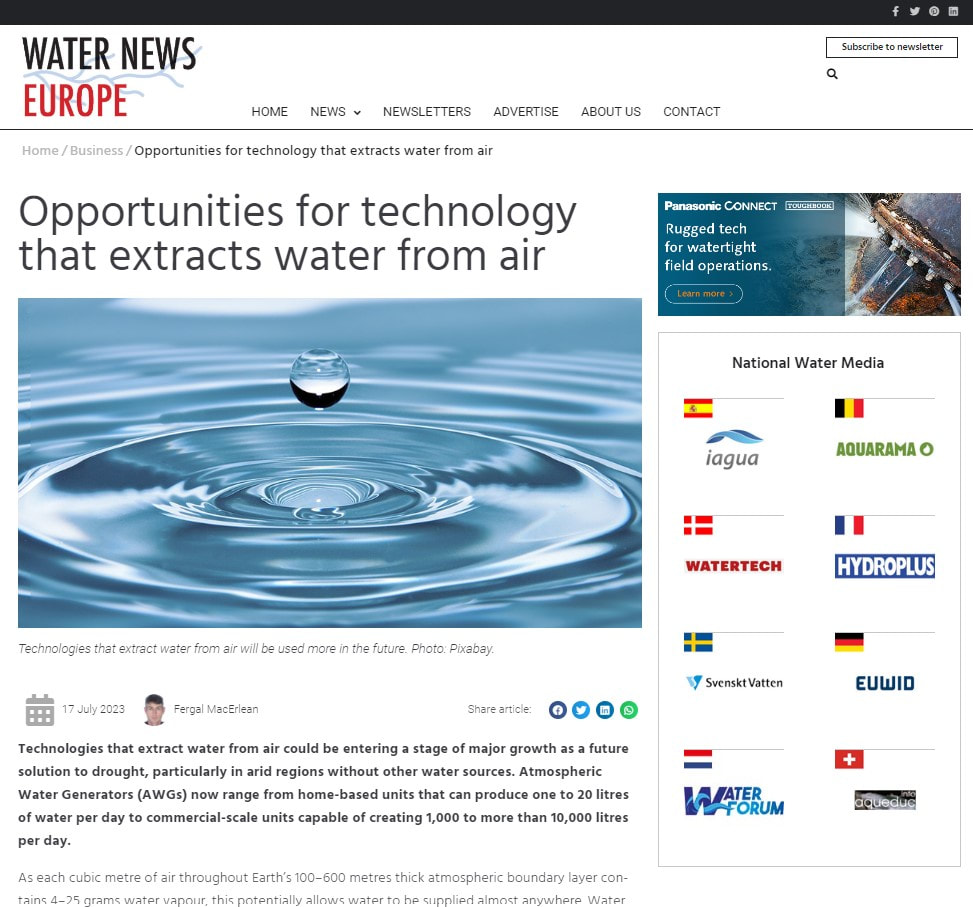
On a well-defined land surface such as a tropical island, atmospheric water vapour processing systems would effectively increase annual precipitation. A viability study for a WaterProducer-Greenhouse™ (WPG) system on the tropical North Atlantic island of Grand Turk (with surface area 18 km^2 = 1800 ha = 18,000,000 m^2) illustrated this effect (Wahlgren, 2002). The proposed WPG system would produce water at a rate of 75,335 m^3 per year. This is equivalent to a rainfall depth of 75,335 m^3 / 18,000,000 m^2 = 0.00418 m = 4.18 mm. The average annual precipitation of Grand Turk is 604 mm. The WPG operation would augment this value by 4 mm (0.7% annually), an amount less than observed natural variability from year to year. The annual total precipitation in 2000, for example, was 704 mm (Wahlgren, 2002, 30). Indirect Environmental Impacts Using new technology such as atmospheric water vapour processing in drinking-water-from-air machines may have other impacts on Nature. These include: • Possibility for more people to live in a region, thereby increasing the population density; • Increased sewage and other waste (including material waste from machines which have reached the end of their operational life and are scrapped); • Increased energy use (to operate the machines); and • Increased material use (to build the machines). Conclusion The quantitative analyses outlined in this bulletin demonstrate that the direct environmental impact of widespread use of atmospheric water vapour processing technology can be considered negligible. In summary, scenarios involving the entire human population using processors of atmospheric water vapour are unlikely, so it is also unlikely that water-from-air technologies will cause a drier atmosphere in the context of the Earth’s water cycle and natural processes of water transport and distribution. References Abbott et al. (2019). Human domination of the global water cycle absent from depictions and perceptions. Nature Geoscience 12, 533–540, 10 June 2019. Gleick, P. H. (1998) The World’s Water 1998–1999: The Biennial Report on Freshwater Resources. Island Press, Washington, DC. van der Leeden, F., Troise, F. L., and Todd, D. K. (1990) The Water Encyclopedia, 2nd ed. Lewis Publishers Inc., Chelsea, Michigan. Wahlgren R. V. 2002. Technical Feasibility Study—Grand Turk Solar Desalination Greenhouse for Water + Food™, 2nd ed. (revised September 2002). Report delivered to Batavia Greenhouse Builders Ltd. by Atmoswater Research, North Vancouver, BC, Canada. Water News Europe published this article in July 2023 outlining the present state of the water-from-air industry. Several industry sources are referenced, including Roland Wahlgren, Atmoswater Research.
Peer-reviewed articles, even about water resources, can be a dry read. But not so for the recently published Open Access article, Increasing freshwater supply to sustainably address global water security at scale. Let me share four excerpts from the paper to inspire and energize us in the water-from-air community. The excerpts show we do indeed have a crucial role in improving access to drinking water.
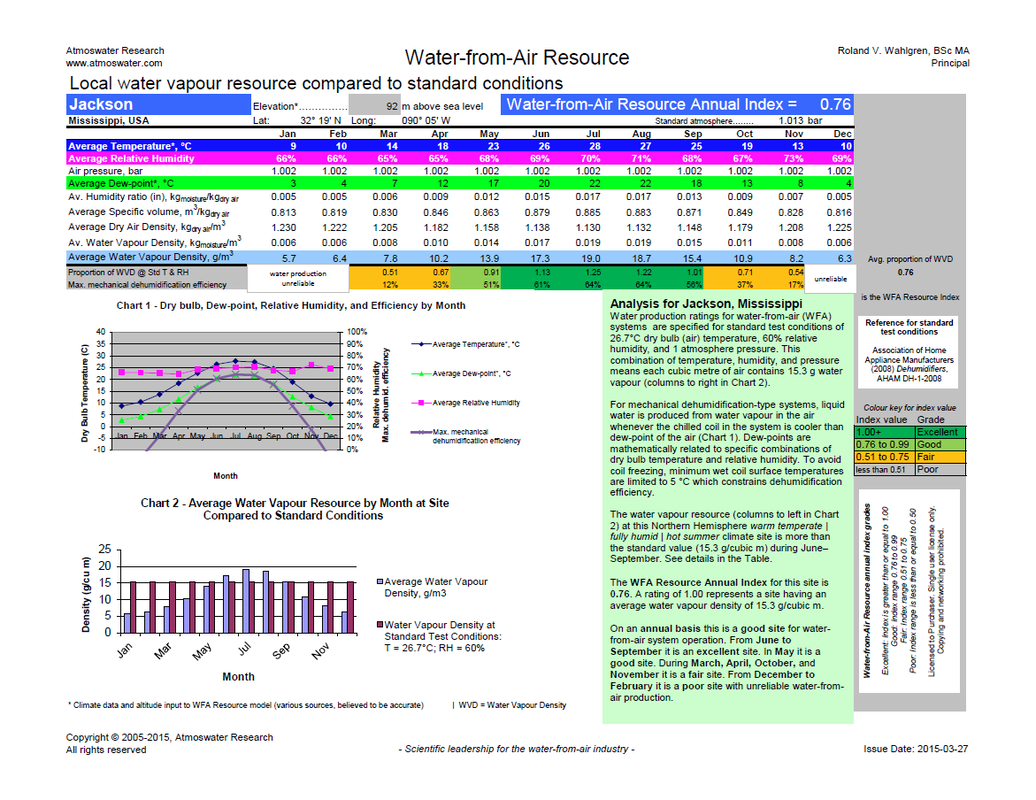
- "...reducing and managing [water] demand are proving inadequate as population and economic growth quickly absorb any capacity that is created through these measures." - "Recycling and reuse of water...have limited scalability because they are fundamentally constrained by the available supply." - "Effective solutions to increase the [fresh water] supply are at present limited, or they are practically non-existent since all resources are being exploited beyond sustainable capacity or rapidly dwindling due to climate change." - "Desalination is not only energy intensive; it also creates concentrated brine and other byproducts that create significant environmental challenges with the cost of disposal." The authors proceed to outline their proposal for a system for siting water vapor collection systems above the surface of the ocean and then transporting the vapor to condensation systems on the nearby shore. They discuss the water vapor resource, the insignificant impact of climate change on viability of their system, the negligible environmental impact, and the financial feasibility. The research trio also claim their ocean-based system will benefit from a higher moisture flux compared to land-based water-from-air installations. The merits of the system outlined in the article remain to be validated but the important learnings from the article for those of us in the water-from-air industry are the quotations about the continuing inability of conventional water resources to provide global water security---thus giving incentive to our industry leadership to continue working diligently to prove the value of developing and commercializing water-from-air technologies. Reference Rahman, A., Kumar, P. & Dominguez, F. (2022). Increasing freshwater supply to sustainably address global water security at scale. Sci Rep 12, 20262 (2022). https://doi.org/10.1038/s41598-022-24314-2. This is an Open Access article. Some water-from-air system suppliers have shown interest in deploying their systems in Jackson.
The city's water system is not functioning properly following recent rains and flooding. Even before these events the water system was unreliable according to NBC News. Is Jackson a good location for water-from-air systems? The Water-from-Air Resource Chart for Jackson grades the atmospheric water resource month-by-month. The chart is available as a free download. The monthly average dewpoint is 3 to 4 degrees C during December to February. Because these temperatures are close to the freezing point of water, some atmospheric water generator (AWG) designs may experience constraints on their water-from-air production capacity during these three months. For the balance of the year AWGs in Jackson should operate satisfactorily. See the chart for more information. Here I refer again to statistics from UNICEF’s Water, Sanitation and Hygiene in Healthcare Facilities: Global Baseline Report 2019 which is found at: https://data.unicef.org/resources/wash-in-health-care-facilities/?mc_cid=f5b26e1fed&mc_eid=1956e675a7) The UNICEF report stated, “In 8 out of 55 countries with data available, more than half of health care facilities lacked handwashing facilities at points of care in 2016”. This is an urgent need that could be filled by appropriately designed AWGs. Today's post presents data about healthcare facilities with no handwashing facilities (Table 7, below). 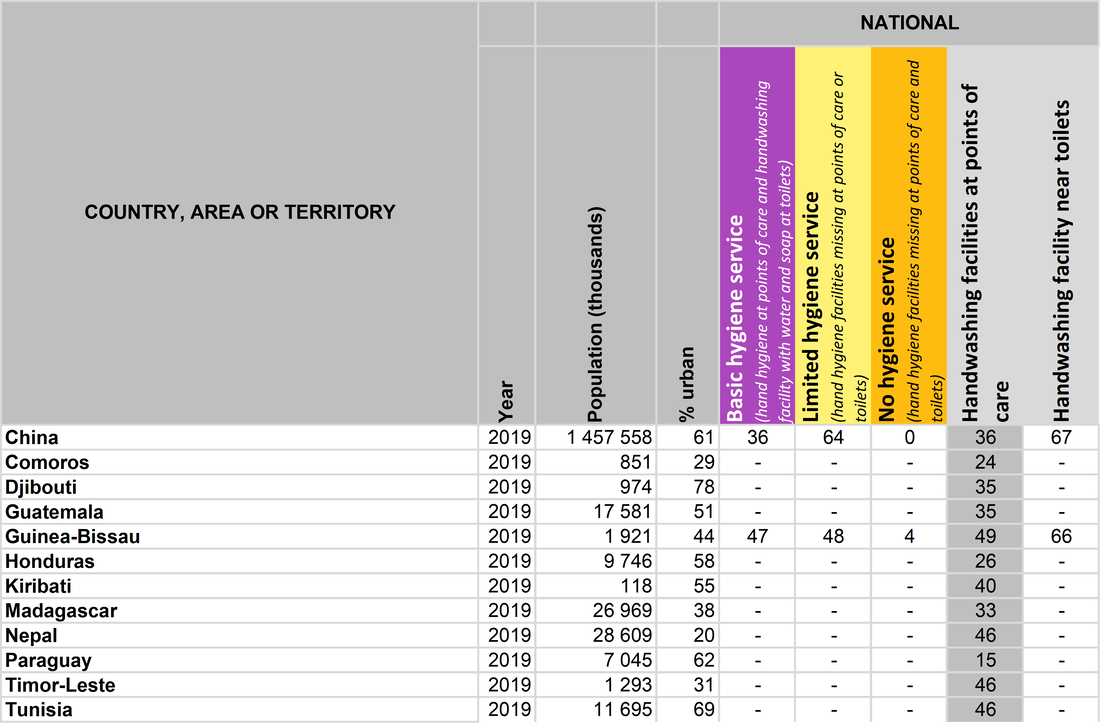 Table 7: Twelve countries, areas, or territories where more than half of healthcare facilities lacked handwashing facilities at points of care. This 2019 data is for 72 of 165 countries in the database. For 93 countries there is no data for hand hygiene materials at points of care. This table was condensed by the writer from a larger table. Data source: Progress on household drinking water, sanitation and hygiene 2000-2020: five years into the SDGs. Geneva: World Health Organization (WHO) and the United Nations Children’s Fund (UNICEF), 2021. Licence: CC BY-NC-SA 3.0 IGO. Data gaps are indicated by a dash (-). The detailed statistical table from which the tables are derived is too large to reproduce in this blog series. The detailed table is available at https://washdata.org/data/downloads (select “World File” under “Health Care Facilities”). Water service data is given for the following regional groupings of healthcare facilities:
This is the final post in this 7-part series about water-from-air market analyses based on the UN's Sustainable Development Goal 6 (Clean Water and Sanitation). Perhaps this series will inspire readers to initiate projects aligned with SDG 6. This alignment will create a demand for AWGs designed to address needs beyond household drinking water. AWGs are needed for household sanitation, basic water services in schools, handwashing in schools, basic water services in healthcare facilities, and healthcare handwashing facilities. Innovative business models are needed to allow water-from-air system suppliers to participate in achieving SDG 6 targets. Statistics from UNICEF’s Water, Sanitation and Hygiene in Healthcare Facilities: Global baseline report 2019 https://data.unicef.org/resources/wash-in-health-care-facilities/?mc_cid=f5b26e1fed&mc_eid=1956e675a7) show the commercial potential for AWGs in the healthcare facility market in two market segments:
An estimated 896 million people use health care facilities with no water service and 1.5 billion use facilities with no sanitation service. It is likely that many more people are served by health care facilities lacking hand hygiene facilities and safe waste management. Today's post presents data about healthcare facilities with no water service (Table 6, below). 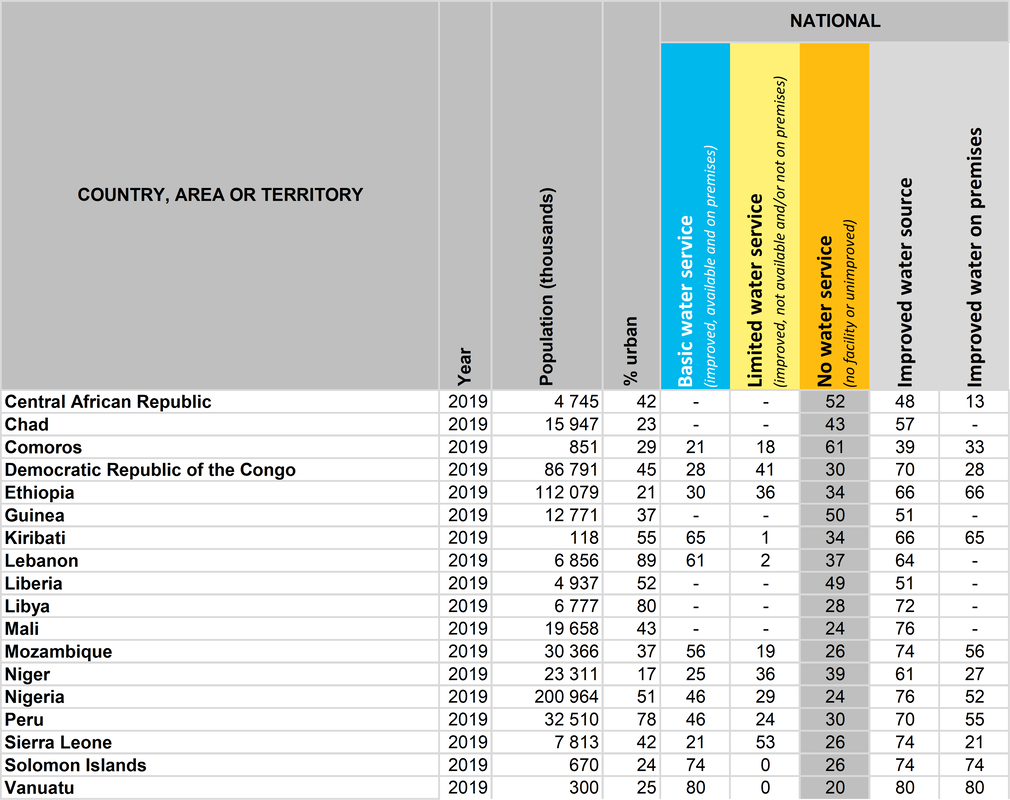 Table 6: Eighteen countries, areas, or territories have no water service in at least 20% of their healthcare facilities. This 2019 data is for 79 of 165 countries in the database. For 86 countries there is no data for no water service in healthcare facilities. This table was condensed by the writer from a larger table. Data source: Progress on household drinking water, sanitation and hygiene 2000-2020: five years into the SDGs. Geneva: World Health Organization (WHO) and the United Nations Children’s Fund (UNICEF), 2021. Licence: CC BY-NC-SA 3.0 IGO. Data gaps are indicated by a dash (-). Basic hygiene services in schools depends on clean water being available for handwashing. AWGs could be designed specifically for this application. Table 5 below shows the national statistics. The world file tables available at https://washdata.org/data/downloads also show urban and rural statistics so quite detailed market analyses are possible. 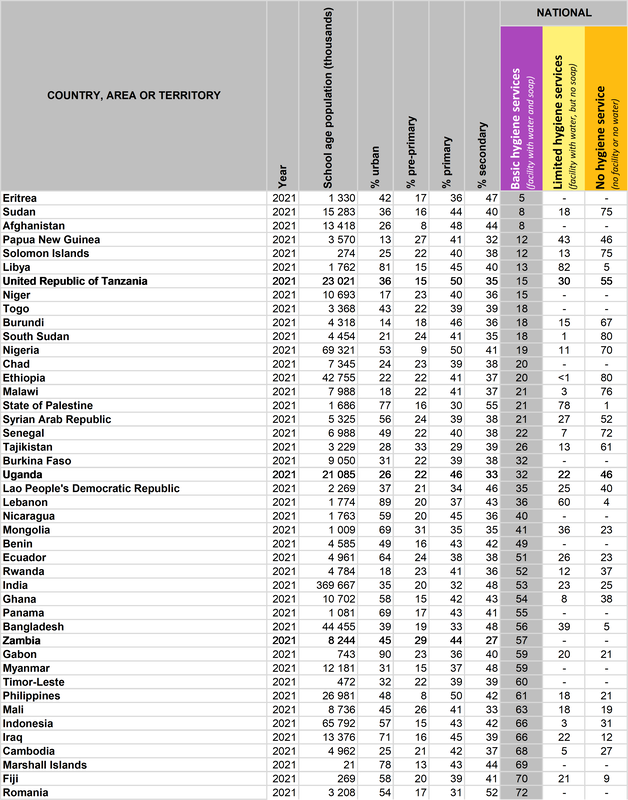 Table 5: Forty-four countries, areas, or territories have school basic hygiene services less than 75% of the school age population. This data is for 121 out of 180 countries in the database. For 59 countries there is no data for school basic hygiene services. The blog author condensed and sorted the data according to lowest to highest national proportion of basic hygiene services. Data source: Progress on household drinking water, sanitation and hygiene 2000-2020: five years into the SDGs. Geneva: World Health Organization (WHO) and the United Nations Children’s Fund (UNICEF), 2021. Licence: CC BY-NC-SA 3.0 IGO. Data gaps are indicated by a dash (-). It is often said that children are our future. This truism may explain the special interest shown by WHO and UNICEF in compiling statistics about school drinking water services (Table 4, below) and school basic hygiene (Table 5, to be posted later in Part 5 of 7). There is commercial potential for AWGs designed for use in schools in drinking water and handwashing applications. Drinking water AWGs for schools and AWGs for handwashing by students are market segments rarely mentioned by academic researchers developing AWGs and by businesses offering AWG products. Welcome exceptions are the atmospheric drinking water fountain products by Hydrosphair and Skywell. The tables show the enormous potential for appropriately designed AWGs. These tables show the national statistics. The world file tables available at https://washdata.org/data/downloads also show urban and rural statistics so quite detailed market analyses can be done. Countries, areas, or territories with school drinking water services less than 75% of school age population are listed here in Table 4.  Table 4: Forty-four countries, areas, or territories have school basic water services less than 75% of the school age population. This data is for 133 out of 180 countries in the database. For 47 countries there is no data for school basic water services. The blog author condensed and sorted the data according to lowest to highest national proportion of basic water services. Data source: Progress on household drinking water, sanitation and hygiene 2000-2020: five years into the SDGs. Geneva: World Health Organization (WHO) and the United Nations Children’s Fund (UNICEF), 2021. Licence: CC BY-NC-SA 3.0 IGO. Data gaps are indicated by a dash (-). There are seventy-two countries, areas, or territories in which less than 75% of the population lives in households having safely managed sanitation (Table 3, below). Safely managed sanitation has these two properties: improved sanitation facility not shared with other households and excreta are disposed of in situ or transported and treated off-site. Many countries in the drinking water list (Table in blog post 2 of 7) do not appear in the sanitation list (Table 3, below) because of gaps in the national sanitation data. The countries so affected do, however, have national statistics for “latrines and other”, “septic tanks”, and “sewer connections”. For the record, 16 countries were expected to be in both tables but were not (in order of lowest to highest national proportion of safely managed drinking water): Rwanda, Uganda, Afghanistan, Cambodia, Côte d’Ivoire, Pakistan, Congo, Tajikistan, Nicaragua, Guatemala, Wallis and Futuna Islands, Uzbekistan, Democratic People’s Republic of Korea, Kyrgyzstan, Albania, and Republic of Moldova. Surprisingly, the list in the Sanitation Table below contains some countries that are in the High-income group as defined by their nominal values of Gross National Income (GNI) per capita in 2020‒2021 [>US$12,695; Atlas method— indicator of income developed by the World Bank; Wikipedia: List of countries and dependencies by GNI (nominal) per capita, USD]. These high-income group countries with relatively great household sanitation challenges are: Australia; China, Macao SAR; Croatia; Norway; Saudi Arabia; and Slovenia. Because of their relatively high per capita income status, these countries are good initial marketing targets for versions of AWGs designed to provide clean water for sanitation applications. 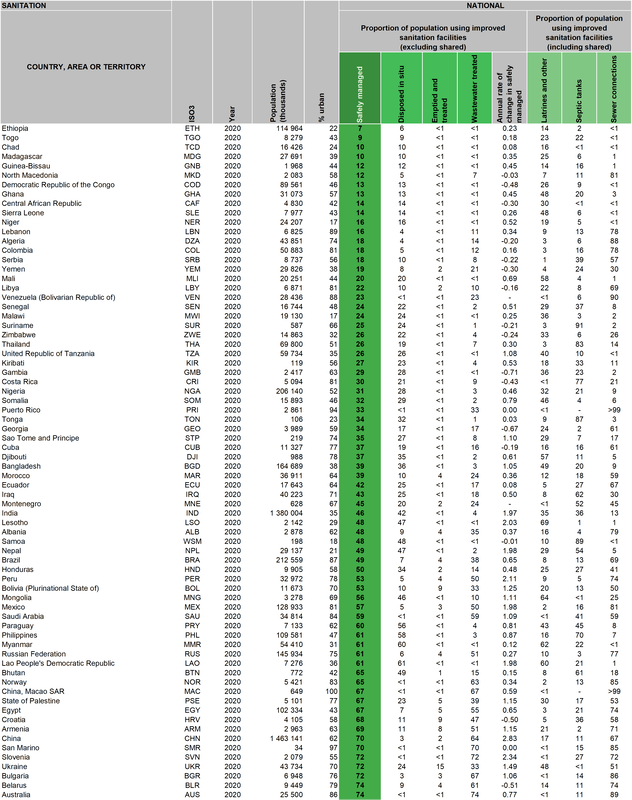 Table 3: Seventy-two countries, areas, or territories with household sanitation safely managed less than 75%. This data is for 120 out of 234 countries in the database. For 114 countries there is no data for safely managed household sanitation. The image is an excerpt from a larger table. The blog author condensed and sorted the data according to lowest to highest national proportion of safely managed. Data source: Progress on household drinking water, sanitation and hygiene 2000-2020: five years into the SDGs. Geneva: World Health Organization (WHO) and the United Nations Children’s Fund (UNICEF), 2021. Licence: CC BY-NC-SA 3.0 IGO. Data table downloads (Microsoft Excel® format) are available at https://washdata.org/data/downloads#. Some high-income countries are in this list (see text). Data gaps are indicated by a dash (-). In Table 1 (Blog post 1 of 7 in this series), the shortfall for safely managed drinking water is 2 billion people. The shortfall for safely managed sanitation is almost twice as many people, 3.6 billion. Why? To understand the commercial potential of AWGs and formulate marketing strategies it is crucial to know the reasons. In 2014, a blog post titled “Water and Sanitation for Health: Why is Progress Slow?” was published by Q. Wodon, Lead Economist, Education Sector, World Bank and C. T. Nkengne, Economist, Poverty Global Practice, World Bank Group
(https://blogs.worldbank.org/health/water-and-sanitation-health-why-progress-slow). Their main points help to answer why:
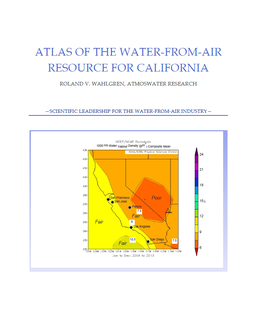
I have noted, over many years in the water-from-air field, that academic researchers and businesses are focused almost totally on providing potable water—sanitation gets mentioned rarely, if at all. But clean water is essential for personal hygiene for men, women, children, and infants—using polluted water or not having any water at all for sanitation applications has the potential for causing dreadful health problems. Designing versions of AWGs specifically for personal hygiene could be a competitive advantage that would also improve the quality of life for millions of people. California's Water Supply Strategy (19-page document; click on the image above to read it) was published in August 2022. The strategy includes:
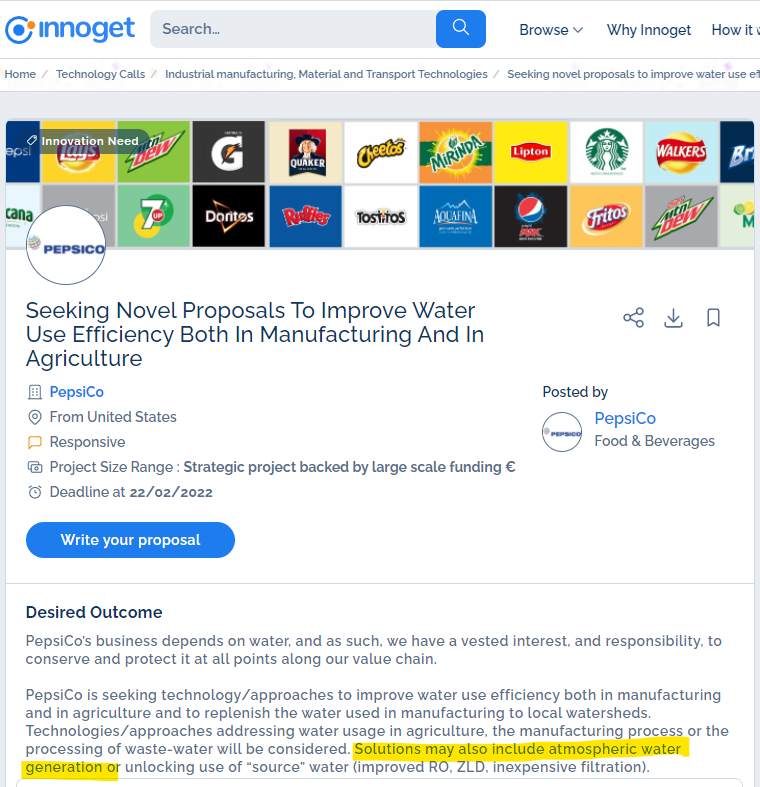
Intriguingly, the Strategy document says, "Rising temperatures evaporate more water, but more of that water stays in the air." (page 1 of 16). AWG's can recover that sequestered water. The knowledge-base for using atmospheric water generators in California includes: PepsiCo mentioned AWGs in its recent call for proposals to improve water use efficiency. You may click on the image above to reach the Innoget website with the proposal call.
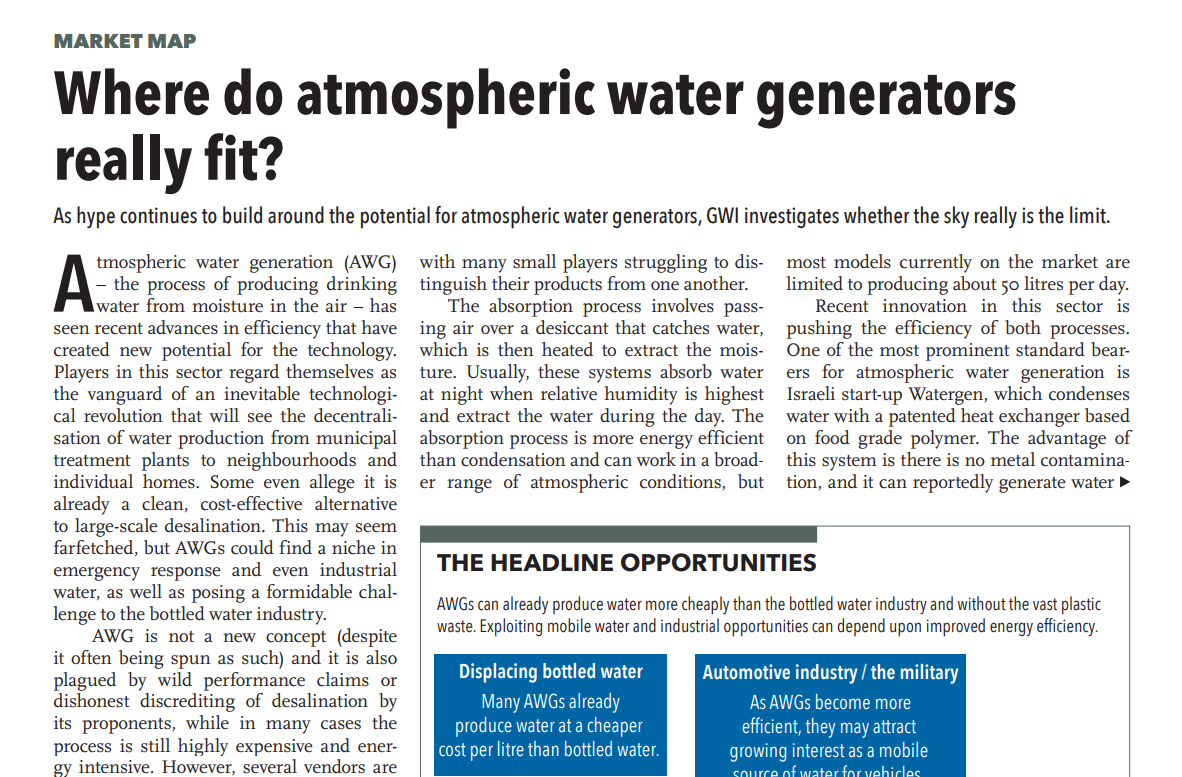
Status of the water-from-air industry in 2021 from the viewpoint of Global Water Intelligence18/11/2021 This interesting article by Global Water Intelligence (GWI) gives their view of the state of the water-from-air industry in July 2021. Drupps AB provided a link to the full article via their website.
My answers to questions asked in Oct. 20, 2020 Webinar: Introduction to Atmospheric Water29/10/2020 Participants at this well-attended webinar had lots of questions---too numerous to answer during the Q & A period at the end of the webinar. So the three panelists were asked to reply to a set of questions---the answers were sent recently to the registered attendees. Here are my answers to the set of eight questions assigned to me. They cover a variety of topics. I hope you find the answers interesting and useful.
Impact on the atmospheric water reservoir from using water-from-air systems: an update (2021-09-27). [The big picture is the water cycle. Every moment, myriad processes, natural and human-caused, are evaporating and condensing huge amounts of water. Liquid water that humans consume for drinking is only temporarily with-held from the water cycle (hours or days). The atmosphere contains 15.5 million million cubic meters of water according to a 1995 report by the American Geophysical Union. Various natural processes already transport and distribute vast volumes of water vapor and liquid water across Earth. Even if every single human alive in 2050 (using the UN's 2007 projection for a population peak of 9,200 million people) used water from water-from-air machines at the rate of 50 L (0.050 cubic meters) per day, they would consume (temporarily) only 0.003% of the available atmospheric water. This scenario involving the entire human population is unlikely, so it is also unlikely that water-from-air technologies will cause a drier atmosphere in the context of the Earth’s water cycle and natural processes of water transport and distribution. Water vapor, the gas phase of water, diffuses along pressure gradients to zones of lower water vapor pressure. If a lot of water vapor was condensed into liquid water in a specific region such as a city, water vapor from outside the region would flow in immediately. No net loss of atmospheric water vapor density would be observed in the city. Water consumed for domestic water requirements does not exit from the water cycle. Within a day or so the liquid water that is used or temporarily with-held from the water cycle would be returned to the environment by evaporating into atmospheric water vapor. On a clearly bounded terrestrial surface such as a tropical island, atmospheric water vapor processing systems would increase slightly the annual precipitation. Let us say a large-scale AWG array is installed on an island such as Grand Turk (Turks & Caicos Islands). The island has a surface area of 18 square kilometers (1,800 ha). The AWG array produces water from the air at a rate of 75,335 cubic meters annually. This is equivalent to a rainfall of 7,533 mm over one hectare (10,000 square meters). The average annual precipitation of Grand Turk is 604 mm. This value would be enhanced by [7,533 mm/ha/1,800 ha] = 4 mm (or 0.7% annually, an amount less than the natural variability from year to year. The annual total precipitation in the year 2000, for example, was 704 mm. To reinforce the fact that long-term human direct impact on atmospheric water is negligible, note that dehumidifiers and air-conditioners dripping condensate have been increasingly used since the 1950s. I used NOAA global specific humidity data (measured in grams of water per kilogram of air) and subtracted the earlier 30-year 1951 to 1980 annual field from the more recent 39-year 1981 to 2019 field. The resulting map showed several pools of higher specific humidity (+2 g/kg). These are likely related to climate change. Drying of about -2 g/kg is noticeable over the Sahara and Gobi deserts---more likely to be related to climate change than use of HVAC equipment. Over most of Earth specific humidity has been remarkably stable (+/-1 g/kg) for the past seven decades. By the way, I posted the map in the Atmoswater Research blog. Indirect environmental impacts are more likely. These will be related to the materials used in manufacturing AWGs, product life cycle aspects, and so on. Also, AWGs will enable humans to expand their footprint which could increase population density in a region, lead to increased sewage and waste disposal challenges, and increase energy use. These analyses indicate widespread global atmospheric water use will not noticeably affect the world climate.]
More conventional sources of water have these electrical energy costs: - Surface water, public supply: 0.37 kWh/cubic meter (Young, 2014) - Groundwater, public supply: 0.48 kWh/cubic meter (Young, 2014) - Tap water, 0.46 kWh/cubic meter (Gleick & Cooley, 2009) - Municipal water (S California): 3 kWh/cubic meter (Gleick & Cooley, 2009) - Seawater Desalination (reverse osmosis): 2.5 to 7 kWh/cubic meter (Gleick & Cooley, 2009) - Seawater Desalination (reverse osmosis): 2 kWh/cubic meter (Elimelech & Phillip, 2011, p. S1) - Bottled Water: 519 to 945 kWh/cubic meter [Gleick & Cooley, 2009; thermal energy units were converted to electrical energy units (3:1) to derive these values] It was interesting to discover that AWGs used in tropical climates are competitive with bottled water. Keep in mind the apparently cheaper conventional sources may not even be available in some water scarce regions. The desalination costs do not include the apparently difficult to monetize costs of harming local ecosystems with brine disposal. References: Elimelch, M. & Phillip, W. A. (2011) Supporting Online Material for The Future of Seawater Desalination: Energy, Technology, and the Environment. Science 333, 712-717. Gleick, P. H. & Cooley, H. S. (2009). Energy implications of bottled water. Environ. Res. Lett. 4 (2009) 014009 (6pp). Young, R. (2014). Watts in a Drop of Water: Savings at the Water-Energy Nexus. An American Council for an Energy-Efficient Economy (ACEEE) White Paper. Retrieved from https://www.aceee.org/sites/default/files/watts-in-drops.pdf
- AWG rated for 5 gal/day: $300/gal (residential quality) - AWG rated for 10 gal/day: $420/gal (balance of list is commercial/industrial quality) - AWG rated for 40 gal/day: $178/gal - AWG rated for 140 gal/day: $121/gal - AWG rated for 800 gal/day: $98/gal - AWG rated for 1800 gal/day: $82/gal
The energy cost of water produced by a desiccant AWG was estimated two ways (note that kilowatt is a unit of power---the energy unit is kilowatt x hours, kWh, which is power acting over a period of time): a. Specifications for a line of industrial rotary desiccant dehumidifiers (using electrical energy) manufactured by Hangzhou Peritech Dehumidifying Equipment Co., Ltd. (http://www.desiccantwheeldehumidifier.com/sale-2082217-industrial-rotary-desiccant-dehumidifier-silica-gel-economical-dehumidifier.html). Their 14.4 L/day model produces water using 2.8 kWh/L (10.6 kWh/US gal or 10,600 kWh per 1000 US gal). Their 1,102 L/day model produces water using 1.3 kWh/L (4.9 kWh/US gal or 4,900 kWh per 1000 US gal). b. Using information in the SOURCE Global (formerly Zero Mass Water) Patent Application US 2018/0043295 A1. The document includes an example of operation in Amman, Jordan at 14:00 on a July day. Airflow is 90 cfm. Relative humidity is 30%. A solar thermal panel with surface area 1.5 square meters provides 700 W (at 50% efficiency) to heat the desiccant to release captured water at the rate of 0.3 L/h. This information can be interpreted three different ways because international consensus is lacking on comparing different energy sources (e.g., solar thermal versus electricity; read more at the American Physical Society Site https://www.aps.org/policy/reports/popa-reports/energy/units.cfm). We need to make this comparison because the Peritech dehumidifiers and all chilled-coil AWGs are energized by electricity. i. Thermal energy = electrical energy cost of water = (700 W x 1 h)/0.3 L = 2.33 kWh/L; efficiency of solar thermal assumed to be 100% as per OECD/IEA publication guidelines ii. Equivalent electrical energy cost = 0.76 kWh/L; efficiency of solar thermal assumed to be 33% as per DOE/EIA (USA) publication guidelines iii. Equivalent electrical energy cost = 1.17 kWh/L; efficiency of solar thermal assumed to be 50% as stated in the patent application The range of energy costs for the SOURCE Global patent application example is 2.8 kWh/US gal (2,800 kWh per 1000 US gal) to 8.7 kWh/US gal (8,700 kWh per 1000 US gal). Here are some product design notes applicable to atmospheric water generator products. The notes are based on an interview with Mitch Maiman, Intelligent Product Solutions by William G. Wong of Electronic Design magazine (July 26, 2020).
Essential elements
Common design mistakes to avoid
Best process
Embrace smart products
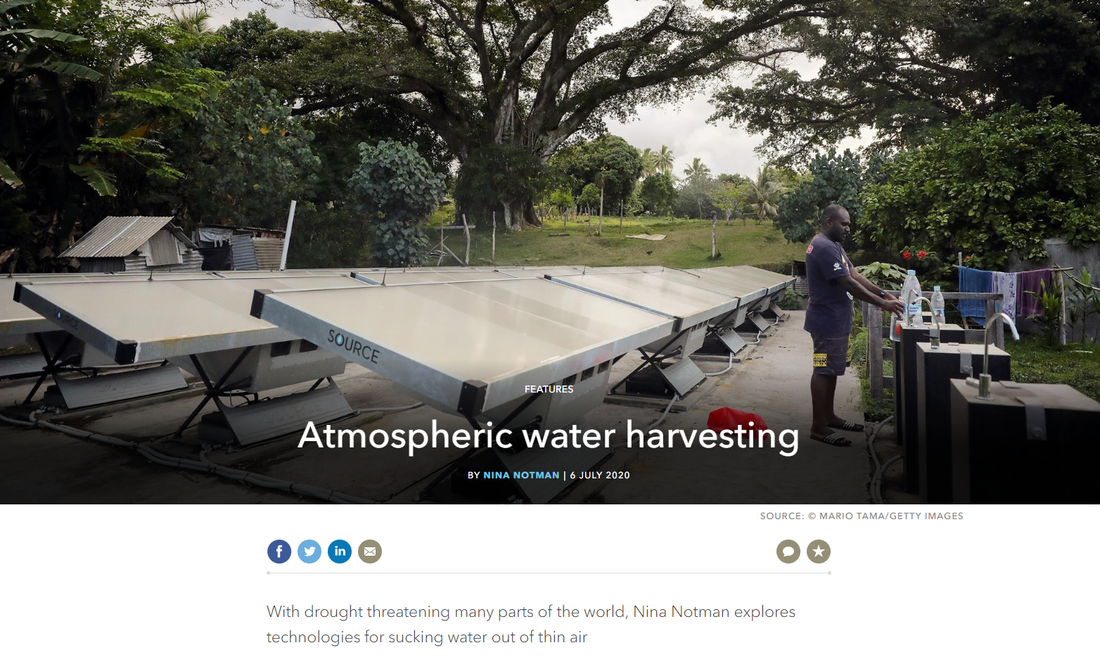
This is an interesting article about the drinking-water-from-air industry. It also includes a section on fog harvesting. Atmoswater Research got a nice mention!
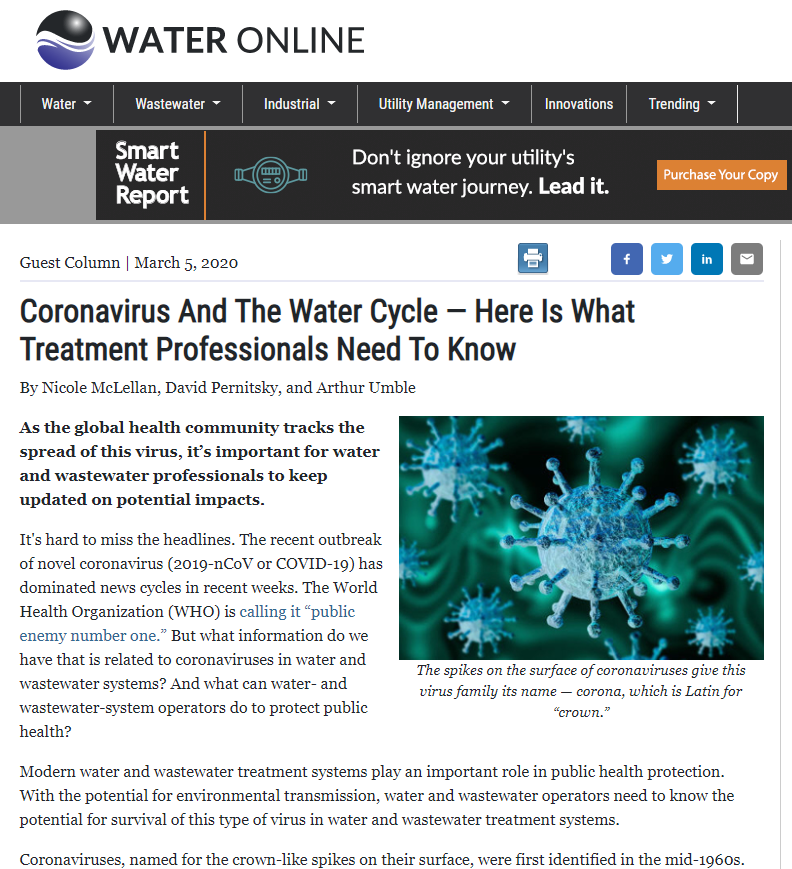
This article is a good overview of the COVID-19 virus in relation to systems processing drinking water and wastewater. Water-from-air machines (atmospheric water generators, AWGs) are, of course, small-scale drinking water systems. Even though the drinking water within the system may be safe, spigot handles and machine surfaces could be contaminated by viruses and bacteria. Machine users should wash their hands before operating the machine. Machine surfaces, spigots, and spigot handles should be sanitized frequently. For the air-side of water-from-air systems, relevant information is provided at ASHRAE Resources Available to Address COVID-19 Concerns. For the water-side of water-from-air systems there are two good sources of information:
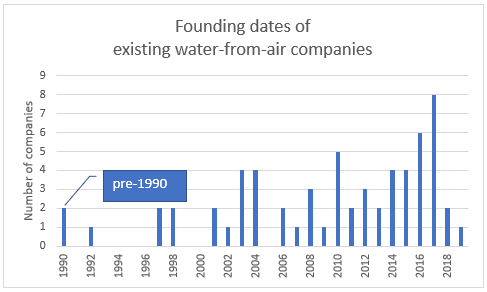
The Water-from-Air Industry is actively growing! This chart is from the data table below tabulating the founding years for Water-from-Air companies [suppliers of Atmospheric Water Generators (AWGs)]. Companies that failed between 1990 and the present are not included. Only those companies with active websites as of today are included. Founding year information is from the company websites or the LinkedIn profiles of the companies or their founders. The two pre-1990 companies were not set up initially as water-from-air equipment suppliers. Companies started in the 2016–2017 peak years were not apparently a direct response to the Water Abundance XPrize competition which ran during 2016–2018. Founding years were not available for 11 of the 73 companies listed below. The last 10 years saw the formation of 37 firms—half of the existing companies. There has been no apparent merger and acquisition activity. Dozens of companies are marketing actively their AWGs. At least two or three dozen units are operating worldwide (see Case Studies page). According to O'Callaghan and others (2018) when "at least 3 companies actively offer versions of the technology; [with] more than 12 full-scale units in operation" this is one signal the industry is in the "Early and Late Majority" stage which can typically last 12 to 16 years. Two other signals stated by O'Callaghan and colleagues are that "Consulting engineers now specify the technology..." and "Efficiencies [are] gained in engineering design and process optimization." Reference: O'Callaghan, P. and others (2018). Development and Application of a Model to Study Water Technology Adoption. Water Environment Research, June 2018, 563–574. Data Table pre-1990 (2)
1992 (1)
1994 1995 1996 1997 (2)
2000 2001 (2)
2006 (2)
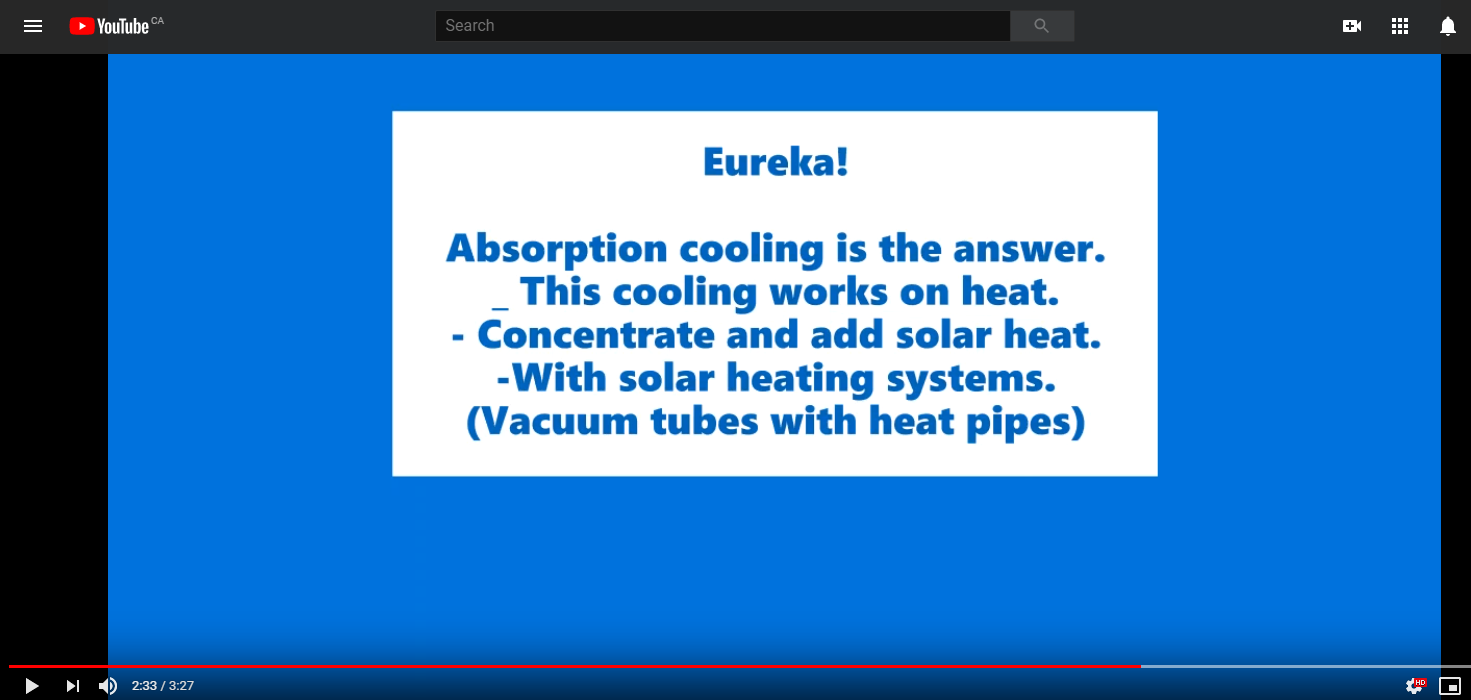
This YouTube video by the Dutch foundation, Happy With Water Foundation, reviews several atmospheric water vapour processing methods and then states that an absorption cooling method using solar energy and vacuum tubes with heat pipes reduces the energy cost of water making it relatively more affordable and practical compared to most other options.
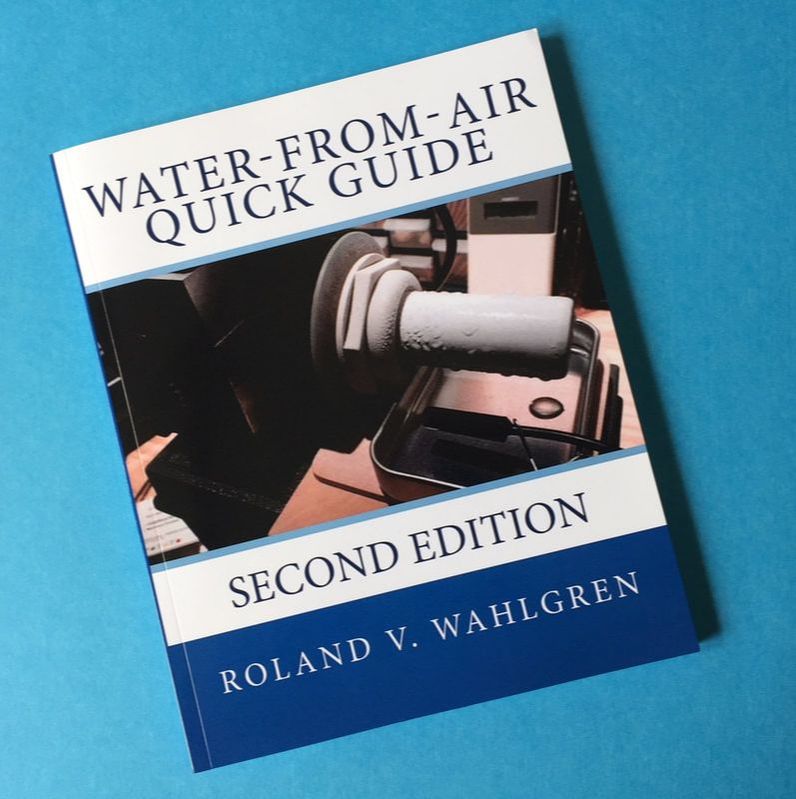
In response to a reader's comments, the July 2018 reprinted second edition incorporates enhanced temperature versus relative humidity psychrometric tables in Chapter 4 with wider temperature ranges (0–55 °C; 32–132 °F) for finding water vapour density, humidity ratio, and dew-point. This makes the tables more useful for cities like Abu Dhabi, Doha, and Dubai.
This reprint also has a revised Appendix 6: Economics of Off-grid Solar PV for WFA. There are two detailed examples in the Appendix. The first example is for a 1.05 kW input power atmospheric water generator using 1-phase electric power. The second example is for a 2.1 kW input power atmospheric water generator using 3-phase electric power.The Appendix presents clear diagrams showing the main components of single-phase and three-phase off-grid solar PV systems. The Appendix concludes by revealing, for each example, the ratio comparing the price of an off-grid solar PV system to the price of the atmospheric water generator. The Water-from-Air Quick Guide may be purchased from Amazon. Thermoelectric cooling technology has had wide appeal as an alternative to mechanical refrigeration cooling technology for at least twenty years. Thermoelectric systems avoid the use of hazardous, harmful refrigerants and noisy compressors. Low coefficient of performance (COP, in the range of 0.9–1.2) is the main problem preventing widespread use of thermoelectric cooling especially for systems requiring large cooling capacities (Riffat & Ma, 2004). A COP of 1.2151, achieved using a multistage thermoelectric module, was considered "remarkable" by Patel and others (2016) Only smaller capacity niche applications have been commercialized.
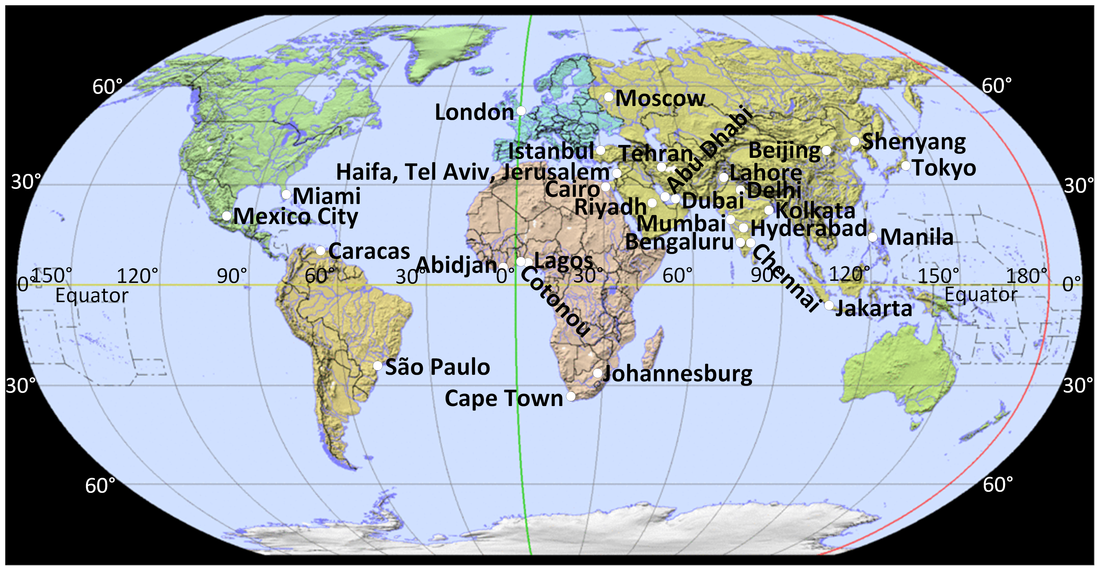
There have been several peer-reviewed papers published and patents issued for atmospheric water generators or dehumidifiers using thermoelectric cooling devices which use the Peltier effect. Some information and products have been featured on websites. Each reference below represents a clickable link to more information. Examples of papers Atta, R. M. (2011). Solar Water Condensation Using Thermoelectric Coolers. International Journal of Water Resources and Arid Environments, 1(2), 142–145. Milani, D., Abbas, A., Vassallo, A., Chiesa, M., & Bakri, D. A. (2011). Evaluation of using thermoelectric coolers in a dehumidification system to generate freshwater from ambient air. Chemical Engineering Science 66(12), 2491-2501. Muñoz-Garcia, M. A., Moreda, G. P., Raga-Arroyo, M. P., and Marin-González, O. (2013). Water harvesting for young trees using Peltier modules powered by photovoltaic solar energy. Computers and Electronics in Agriculture 93, 60–67. Nandy, A., Saha, S., Ganguly, S. & Chattopadhyay, S. (2014). A Project on Atmospheric Water Generator with the Concept of Peltier Effect. International Journal of Advanced Computer Research, 4, 481–486. Suryaningsih, S. & Nurhilal, O. (2016). Optimal design of an atmospheric water generator (AWG) based on thermo-electric cooler (TEC) for drought in rural area. AIP Conference Proceedings 1712, 030009 (2016); doi: 10.1063/1.4941874 Davidson, K. B., Asiabanpour, B., & Almusaied, Z. (2017). Applying Biomimetic Principles to Thermoelectric Cooling Devices for Water Collection. Environment and Natural Resources Research 7(3), 27–35. Examples of Patents Peeters, J. P. and Berkbigler, L. W. 1997. Electronic household plant watering device. United States Patent 5,634,342. [expired, now in public domain] Wold, K. F. 1997. Plant watering device and method for promoting plant growth. United States Patent 5,601,236. [expired, now in public domain] Reidy, J. J. 2008. Thermoelectric, High Efficiency, Water Generating Device. United States Patent 7,337,615. Waite, R. K. & Neumann, A. (2017). Water production, filtration, and dispensing system. United States Patent 9,731,218 B2. Examples of Websites The "instructables" website published the article "How to Make a Dehumidifier (Thermoelectric Cooling) in 2016. Amazon.com sells several models of "thermoelectric portable compact dehumidifiers". References Patel, J., Patel, M., Patel, J., & Modi, H. (2016) Improvement in the COP of Thermoelectric Cooler. International Journal of Scientific & Technology Research 5(5), 73–76. Riffat, S. B. & Ma, X. (2004) Improving the coefficient of performance of thermoelectric cooling systems: a review. Int. J. Energy Res. 28: 753-768 (DOI:10.1002/er.991) The target market for atmospheric water generators, in the broadest sense, are people in locations with perennial water shortages due to population growth, climate change, and lack of enough sustainable surface or groundwater within a radius of 100 km. The reference for these defining conditions is: Lalasz, R. (2011). New Study: Billions of City Dwellers in Water Shortage by 2050; retrieved from https://blog.nature.org/conservancy/2011/03/28/pnas-billions-city-urban-water-shortage-2050-nature-conservancy/. A study led by the Nature Conservancy defined these conditions. At least 23 cities fit these conditions. From north to south they are: Shenyang, Beijing, Tehran, Haifa, Tel Aviv, Jerusalem, Lahore, Delhi, Dubai, Riyadh, Abu Dhabi, Kolkata, Mexico City, Mumbai, Hyderabad, Manila, Chennai, Bengaluru, Caracas, Lagos, Cotonou, Abidjan, and Johannesburg. Some small tropical islands such as Grand Turk, Turks and Caicos Islands and Sal Island, Cabo Verde also fit these defining conditions. Recent reports such as “The 11 cities most likely to run out of drinking water - like Cape Town” by the BBC (http://www.bbc.com/news/world-42982959; 11 February 2018) suggest that we could add other cities to the Nature Conservancy’s list. From the BBC report here are nine more cities to add to the list of those likely to run out of sustainable natural water supplies: Cape Town, São Paulo, Cairo, Jakarta, Moscow, Istanbul, London, Tokyo, and Miami.Water-from-Air Resource Charts are available for all the highlighted locations mentioned in this post—just click on the location name to go to the relevant page in the Atmoswater Shop. By the way, if you like bargains, the charts for the 23 water-scarce cities listed by the Nature Conservancy are all included in the book, Water-from-Air Quick Guide.
|
Roland Wahlgren
I have been researching and developing drinking-water-from-air technologies since 1984. As a physical geographer, I strive to contribute an accurate, scientific point-of-view to the field. Archives
May 2024
Categories
All
|
