Atmoswater Research
+1 604-985-3720
  • Home
  • Atmoswater Blog
  • About
  • Contact
  • Books (HVAC&R)
    • Water-from-Air Book
  • Useful Lists
    • Manufacturers and Suppliers of Atmospheric Water Generators & Water-from-Air Machines
    • Case Studies About Water-from-Air
    • Atmospheric Water Generator or Water-from-Air Machine Market Research Links
    • Projects about Water-from-Air
    • Articles about Water-from-Air >
      • ScienceDaily Article Links
    • Patents about Water-from-Air and Atmospheric Water Generators
    • Water Lexicon
  • Links, FAQ, & Video
    • Drinking-water Industry Organizations Links
    • Map of the Water-from-Air Resource
    • Topic Links for Water-from-Air
    • Trends for Water-from-Air
    • Water Industry News Links
    • Water Organizations Links
    • Water-from-Air FAQ
    • Video about Water-from-Air
  • Scientific & Technical Consulting
    • Consulting Physical Geographer
    • Research Services in Climatology, Geomorphology, Hydrology, and Oceanography
    • Translations of Scientific and Technical Documents (Swedish, French)
    • Projects >
      • Our Projects
      • Atmospheric Water Vapour Processing (AWVP)
    • Publications by Roland Wahlgren >
      • Publications List for Roland Wahlgren
      • GSC 77-1A (Beaufort Sea Sediment Cores)
      • M.A. Thesis (Beaufort Sea Ice-scour Tracks)
      • GSC 79-1B (Beaufort Sea Ice-scour Tracks)
      • Waterlines (Water-from-Air)
      • Water Research (Water-from-Air)
      • Acta Hort. (Water-from-Air)
      • CWWA Conference 2014
    • Load Research (for BC Hydro)
    • Ice-scour tracks (Beaufort Sea)
  • Atmoswater Shop
  • Terms, Conditions, Privacy

The #Water-from-Air Resource Chart Explained

5/3/2014

0 Comments

 
The Water-from-Air Resource Chart for Praia, Cape Verde
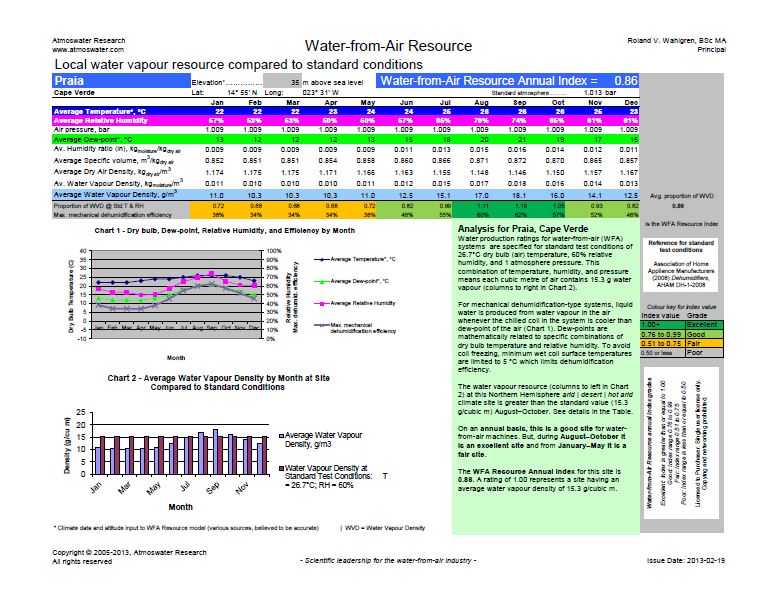
The Water-fom-Air Resource Chart for Praia, Cape Verde (click to enlarge).
Why use a Water-from-Air Resource Chart? Well, this colourful output from a computer model is a marvelous tool for understanding how well water-from-air machines (atmospheric water generators; AWGs) would perform at your location. "Knowledge is power"--there is value to being well-prepared before talking to equipment suppliers, consultants, or project colleagues.

Let me guide you through this information-packed chart.

  • Local water vapour resource compared to standard conditions: At standard conditions of 26.7° C dry bulb temperature and 60% relative humidity and 1 atmosphere air pressure (sea level) there is 15.3 grams of water vapour in every cubic metre of moist air. The local water vapour density (the resource) may be less, equal, or greater. By using a standard it is possible to compare one location to another, compare one month to another, compare one hour to another, and so on.
  • Elevation is an important input to the model because water vapour density normally decreases with altitude.
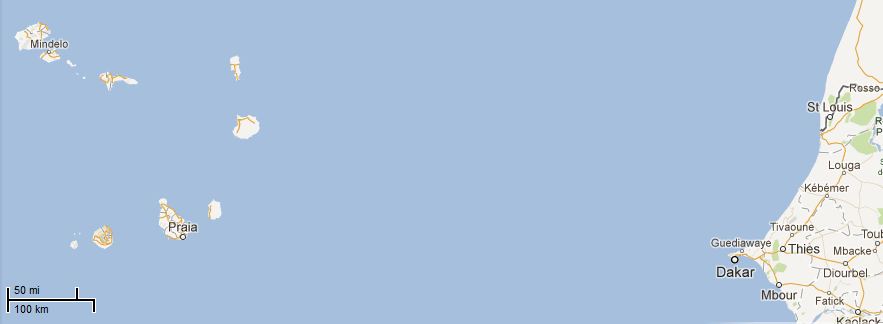
  • Latitude and longitude are for reference—usually water vapour density decreases with increasing latitude north or south (moving from the equator to the poles).
  • Monthly average temperatures for the location are obtained from various reliable sources.
  • Monthly average relative humidity values for the location are calculated by the model once it knows the monthly average dew-points.
  • Monthly average air pressures are calculated from the elevation information relative to the standard atmosphere at sea level which is 1.013 bar.
  • Humidity ratio, specific volume, and dry air density are intermediate values the model needs to calculate the average water vapour density in kilograms of moisture per cubic metre of air.
  • The highlighted-in-blue values of water vapour density have the units [g/cubic metre] to make the values easier to read and comprehend. A gram of water is represented by the 1 mL division on graduated cylinder laboratory glassware.
  • Proportion of water vapour density (WVD) at standard temperature (T) and relative humidity (RH) = (monthly average water vapour density) / (15.3 g/cubic m); This proportion is also called the index value.
  • Maximum mechanical dehumidification efficiency = [(average water vapour density - 6.8 g/cubic m)/(average water vapour density)] × 100%; Where 6.8 g/cubic m is the water vapour density of air at 5°C and 100% relative humidity at 1 atmosphere pressure—this models air leaving a wetted, unfrozen dehumidifier coil as being warmer than the freezing point of water and containing all the water vapour it can hold at the leaving temperature; The efficiency value is constrained to be less than 100% because in practice the coil temperature is regulated to 5­°C or above to prevent freezing of water onto the coil which causes overload and damage to the machine's compressor(s). An exploration of maximum efficiency for mechanical dehumidifiers is found in an earlier blog post.
  • Index value colours are applied to the index and efficiency values so the chart user can grasp at a glance the seasonal pattern of the water-from-air resource. The colour key and grade wording (excellent, good, fair, poor) for the index values is shown at the right-hand side of the page.
  • The annual index value is the average of the monthly index values. 
  • Chart 1 is a month-by-month graphical display of average values of temperature (dry bulb), dew-point, relative humidity, and efficiency.
  • Chart 2 is a month-by-month graphical display of average values of water vapour density (WVD; left blue columns) relative to the constant (right pink/red columns) standard condition WVD = 15.3 g/cubic metre.
  • An analysis section for the location enables each chart to be a stand-alone document with a concise explanations about standard conditions, the dehumidification process, and efficiency. This section also identifies the location's climate zone and expresses in words how effective a water-from-air machine would be at the site throughout the year.

Charts for many different locations are available from Atmoswater Research. You are welcome to ask me to produce charts for places of interest that are not listed yet.
0 Comments

#Water-from-Air Resource charts backstory

30/9/2013

0 Comments

 
Picture: Measuring water productionMeasuring water production from an AWG in Belize
While helping a client commercialize water-from-air systems, I got frequent questions about how well atmospheric water generators would perform at various locations around the world. A common misconception was that relative humidity values told the whole story. Higher humidity means more water in the air and better water production. Right? Not really!

The water vapour content of the air, sometimes referred to as "absolute humidity", has the proper scientific name "water vapour density" with units of [grams of water vapour per cubic metre of air]. The water vapour density depends on three measures all at the same time: the air's dry bulb temperature, relative humidity, and atmospheric pressure.

Monthly average climate data for air temperature (dry bulb) and relative humidity is fairly easy to obtain for many places. Average air pressure at a location can be estimated knowing the site's altitude above sea level. Using well-known formulas used in the heating, ventilation, air-conditioning field (HVAC) the average monthly water vapour density can be calculated.

Once water vapour density was known, I could use information about the airflow (in units of cfm or cubic feet per minute) through my client's machines to estimate water production of various designs. The focus on water production was fine for a manufacturer and its customers.

Later, as an independent consultant, potentially dealing with end-users of atmospheric water generators having all sorts of different specifications for airflow I decided it was better to focus on the actual water vapour resource to make charts of wider usefulness.To make it easier to compare how good a site is for atmospheric water generators I had the idea of indexing the water vapour density by dividing the density values by the water vapour density 15.3 g/cubic metre which is the density at the standard measurement conditions of 26.7°C air temperature; 60 % relative humidity. When the water-from-air resource monthly index = 1.00, the expected drinking water production rate from an atmospheric water generator (AWG) at the site should be the same as the machine's specified water-from-air production rate. I gave the Water-from-Air Resource (WFAR) annual index grades (Excellent: Index is greater than or equal to 1.00; Good: Index range 0.76 to 0.99; Fair: Index range 0.51 to 0.75; and Poor: Index range is less than or equal to 0.5) and assigned colours to make it easier to interpret the charts.

A lot of information about a site, all relevant to using water-from-air systems is packaged onto the 8.5 inch x 11 inch landscape format of the charts!
  • Geographic coordinates and elevation;
  • Monthly average temperature, humidity, pressure, and dew-point;
  • Monthly average water vapour density;
  • Monthly average maximum mechanical dehumidification efficiency;
  • Graph to visualize how temperature, humidity, dew-point, and efficiency vary together by month;
  • Graph to visualize and compare monthly average water vapour density with water vapour density at standard conditions;
  • Summary of the analysis, identifying the climate zone and expected atmospheric water generator performance for various periods during a year; and
  • Annual index to compare the water-from-air resource between locations
After a bit of experience using the charts my clients discover some of their business stress evaporates! Here's why:
  • They don't have to spend their own time and resources responding to ongoing questions about how good or bad a place is for operating water-from-air systems. This gives just a bit extra time for concentrating on growing their business and profits;
  • Risk reduction by understanding the characteristics of the water-from-air resource at a site. Why alienate their customer by selling them a machine that might only work properly a couple of months of the year at a site? Better to forgo that sale and focus on sites where the machine return on investment is more favourable;
  • The charts make their business more valuable—they become more of an expert at what they do;
  • They find it easier to achieve sales targets because quantitative information, rather than a guesstimate is available; and
  • Surprises are removed with having solid quantitative knowledge about the water-from-air resource at sites.

Picture: Example of a Water-from-Air Resource Chart
Water-from-Air Resource Chart for Praia, Cape Verde (click to enlarge).
0 Comments

#Cape #Verde #Water from Air Resource

19/2/2013

0 Comments

 
Picture: Map of Cape Verde
Location of Praia, Cape Verde in Atlantic Ocean west of Senegal and Mauritania (Source: Google Maps)
A Water-from-Air Resource Chart is available for Praia, Cape Verde. This arid | desert | hot arid climate site is a good site for atmospheric water generator operation on an annual basis. Some months are only fair, however, but some months are excellent. See the chart for details.
0 Comments

    Roland Wahlgren

    I have been researching and developing drinking-water-from-air technologies since 1984. As a physical geographer, I strive to contribute an accurate, scientific point-of-view to the field.

    Discover previous interesting and informative scientific/technical posts by clicking "<<Previous" at the bottom of each page!

    Buy the
    Drinking-Water-from-Air Technology: Investor's Guide ("WFA 101").


    Archives

    December 2022
    September 2022
    August 2022
    December 2021
    November 2021
    September 2021
    October 2020
    August 2020
    July 2020
    April 2020
    March 2020
    February 2020
    November 2019
    October 2019
    September 2019
    August 2019
    April 2019
    November 2018
    October 2018
    September 2018
    August 2018
    July 2018
    June 2018
    May 2018
    March 2018
    August 2016
    June 2016
    March 2015
    November 2014
    September 2014
    July 2014
    March 2014
    February 2014
    January 2014
    December 2013
    October 2013
    September 2013
    August 2013
    July 2013
    June 2013
    May 2013
    April 2013
    March 2013
    February 2013
    January 2013
    December 2012
    October 2012
    September 2012
    August 2012
    June 2012
    April 2012
    April 2011
    March 2011
    January 2011

    Categories

    All
    Absorption Cooling
    Advertising
    Afghanistan
    Algeria
    American Samoa
    Anguilla
    Arizona
    Aruba
    Atlas
    Atmospheric Water Generator (AWG)
    Australia
    Azores
    Bahrain
    Belize
    Bermuda
    Brazil
    Business
    California
    Canary Islands
    Cape Verde
    Caribbean
    Case Studies
    Cayman Islands
    Chile
    China
    Colombia
    Condensate
    COVID 19
    COVID-19
    Cyprus
    Desalination
    Design
    Dew Point
    Dew-point
    Dominican Republic
    Drinking Water Industry
    Drought
    Efficiency
    Egypt
    Environmental Impact
    Finance
    Florida
    Gabon
    Ghana
    GHG-IQ
    Global Water Works Connect
    Healthcare Facilities
    Hong Kong
    Hourly Model
    Humidity Ratio
    India
    Indonesia
    Inventions
    Irrigation
    Israel
    Jackson
    Jamaica
    Jordan
    Kenya
    Kiribati
    Kuwait
    Libya
    Liquid Desiccant
    Load Research
    Malawi
    Malaysia
    Malta
    Markets
    Mauritius
    Metal Organic Framework
    Metal-organic Framework
    Mexico
    Mississippi
    Morocco
    Oklahoma
    Panama
    Patents
    Philippines
    Qatar
    Sanitation
    Schools
    SDG6
    Singapore
    Solar PV
    Spain
    Standard Test Conditions
    Sweden
    Texas
    Thermoelectric (Peltier)
    Tunisia
    Turks And Caicos Islands
    United Arab Emirates
    Venezuela
    Video Presentations
    Water Abundance XPrize
    Water Bottling
    Water Cost
    Water Crisis
    Water From Air
    Water-from-air
    Water Pseudo Science
    Water Quality
    Water Scarcity
    Water Science
    Water Vapor Density
    Wfa Hourly Analysis

    RSS Feed

    View my profile on LinkedIn
    Follow atmoswater on Twitter
    Tweets by @atmoswater
Copyright 1999–2023, Roland V. Wahlgren, Atmoswater™ Research. Atmoswater™ is a trademark claimed by Roland V. Wahlgren